Coming in the Binary Ninja 4.1 release (and out now on dev!) is the ability to show instruction addresses and stack offsets in a number of convenient ways.
Relative Addresses in Linear/Graph View
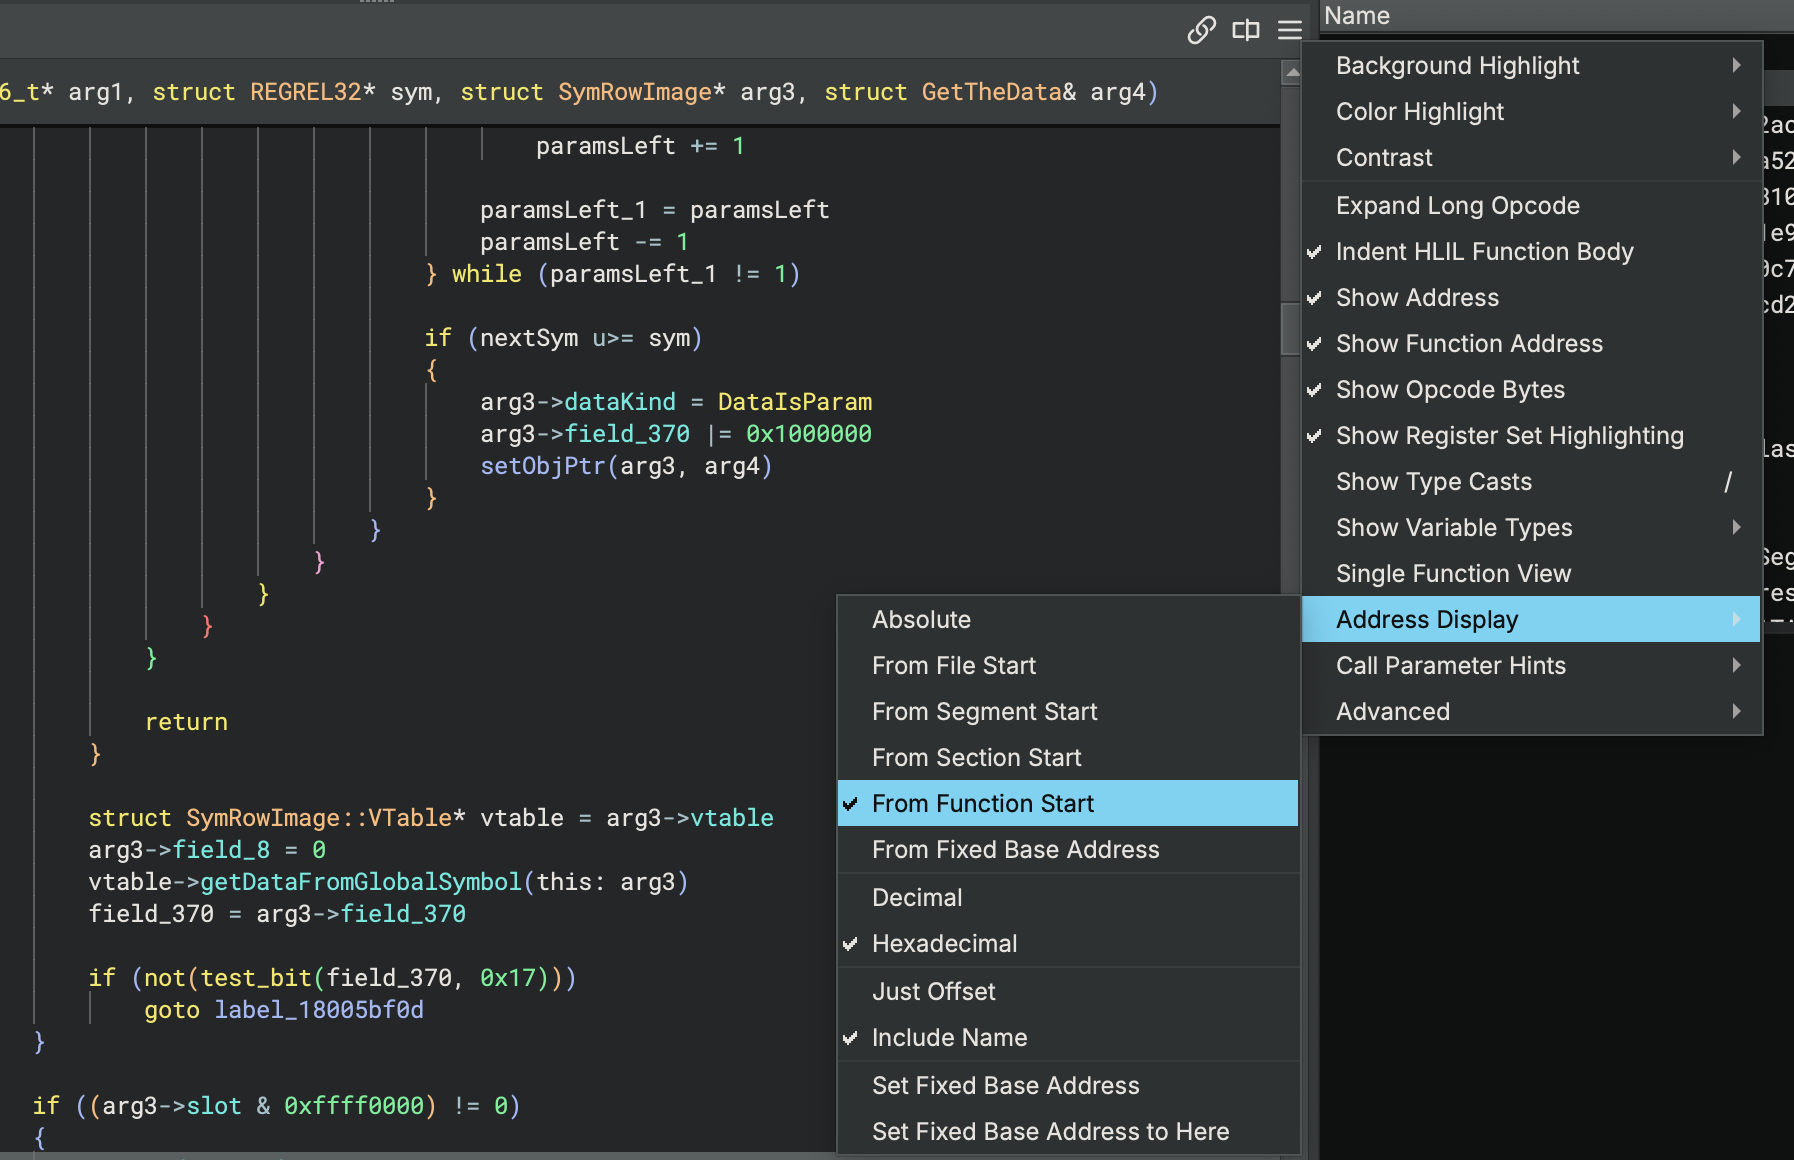
Designed to make it easier to handle binaries run under ASLR, there are a number of new ways you can configure the rendering of instruction addresses, allowing you to see offsets at a glance for every line. These options are available in the view options menu, which you can find under this hamburger menu in the view:
From File Start
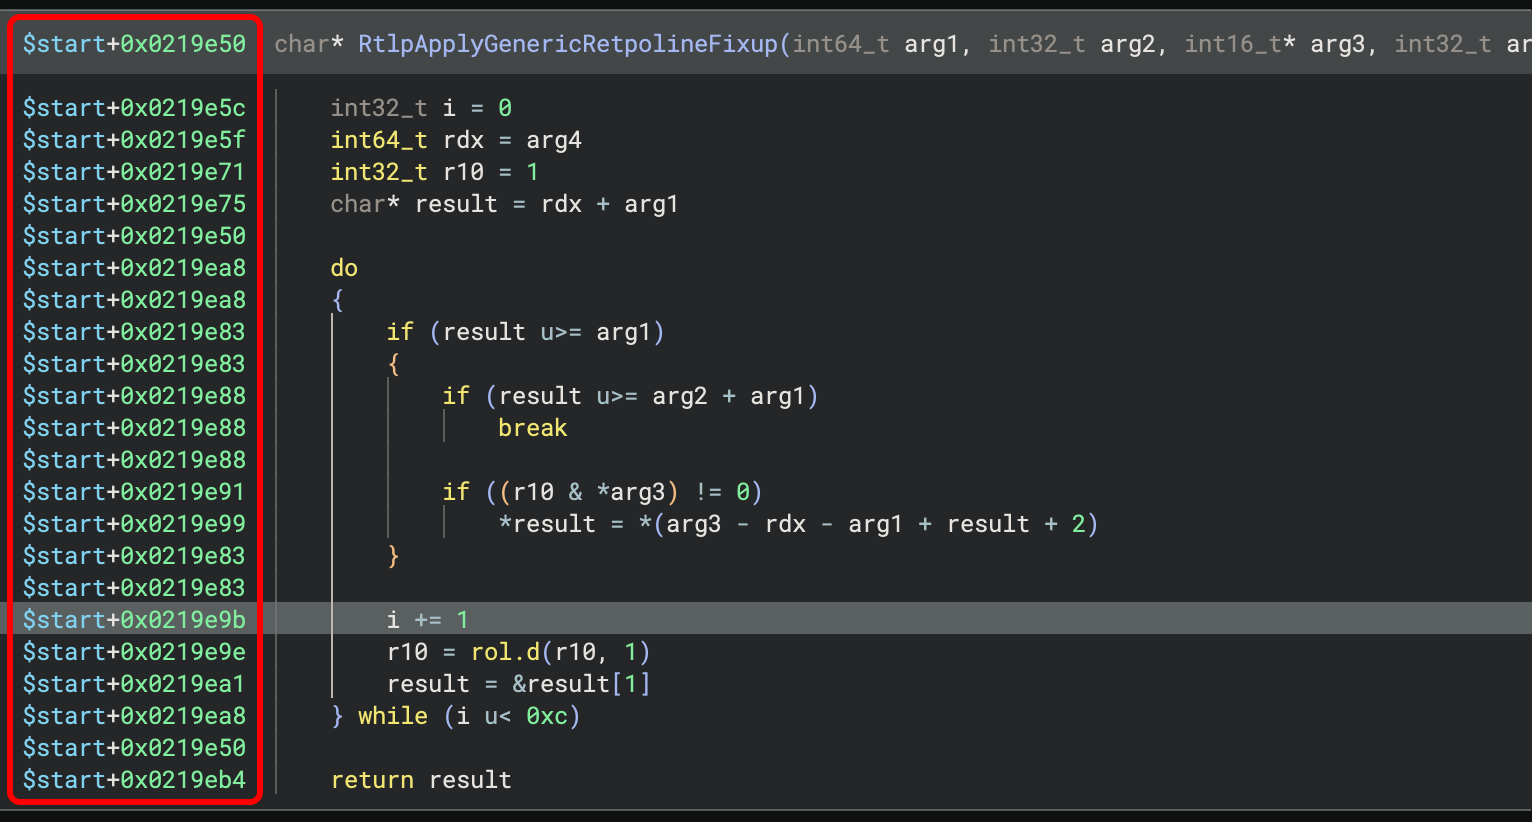
Gone are the days of needing to rebase your whole binary to 0 to see addresses relative
to the start of the file/module. If your binary will be loaded with ASLR/PIE, you can now
replace the arbitrary base address with relative addresses showing the offsets that
actually mean something. For example, in this image, the offsets are rendered relative to
$start, the default placeholder for the start of the BinaryView:
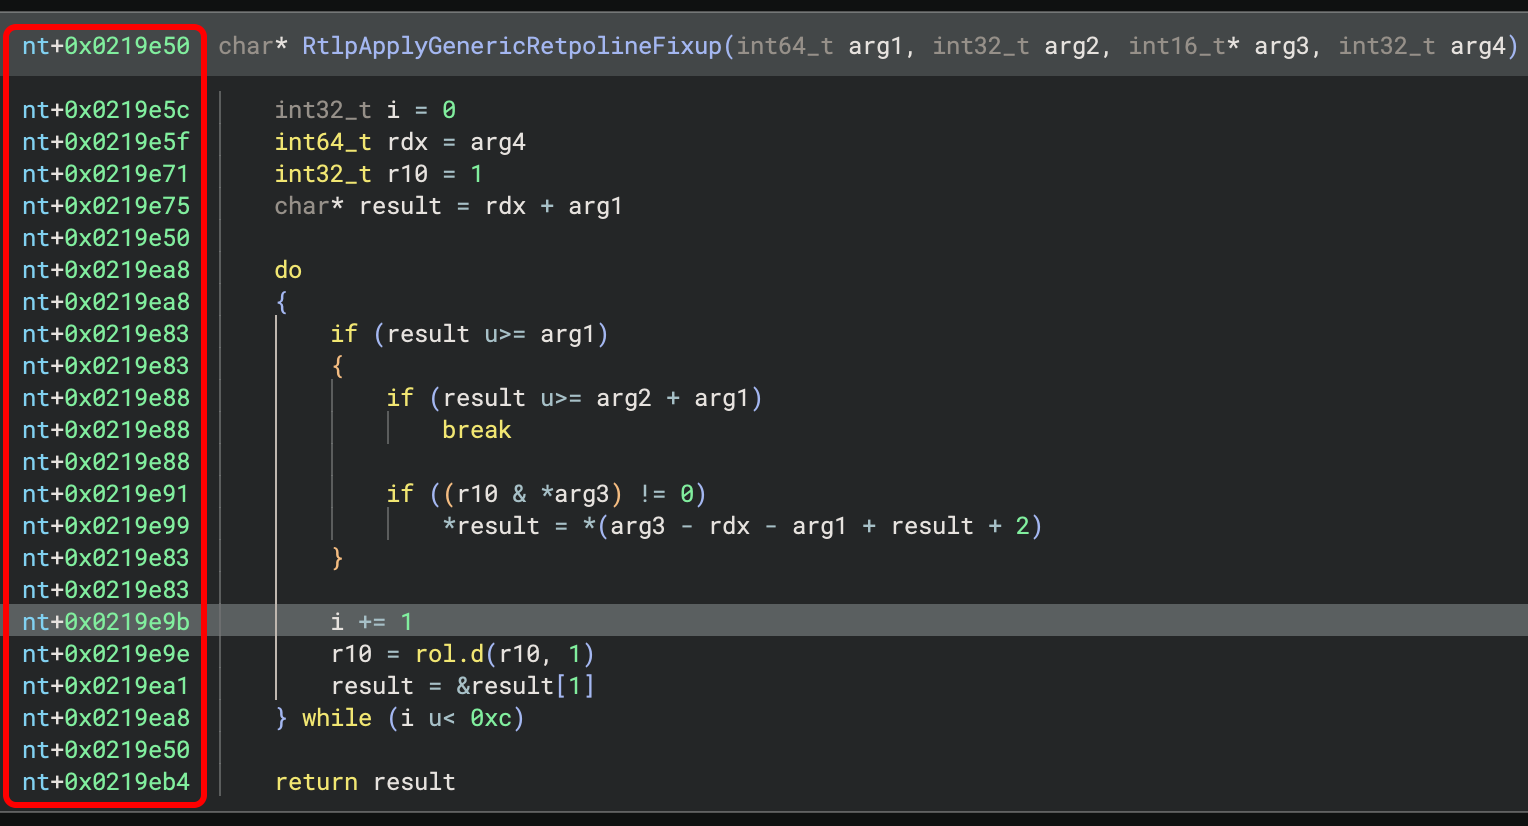
You can also change the displayed name from $start to anything you want, for example,
to match what is displayed in windbg. For example, the offset base in this image has been
named nt to match debugging NT in windbg:
From Segment / Section Start
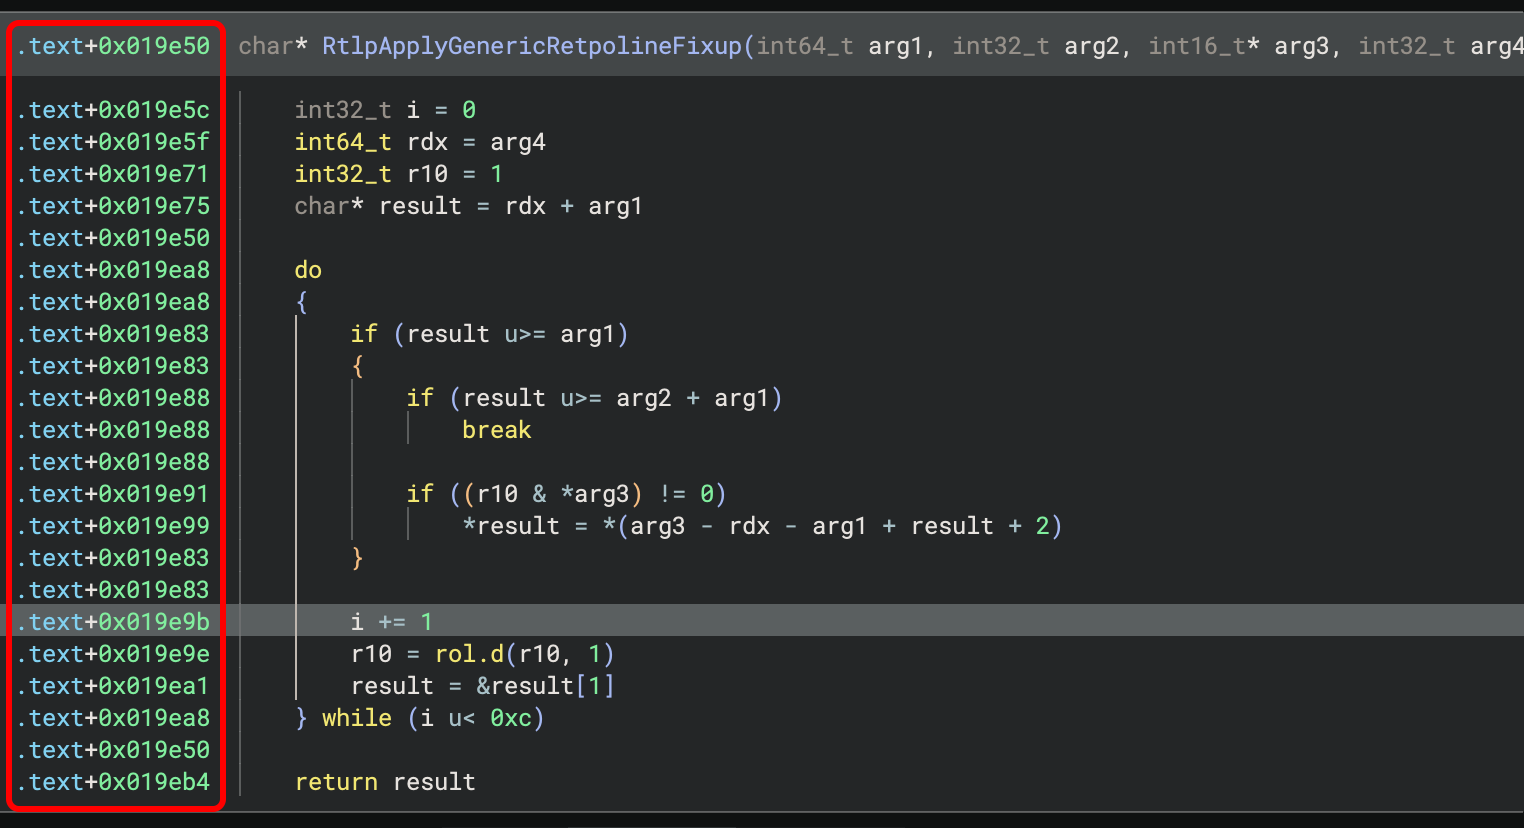
If your binary has lots of segments and sections, or if you have a plugin that loads many
files into individual segments all piled into the same address space, you can display
offsets from segment and section starts. For example, these offsets are rendered
relative to the start of the .text section:
From Function Start
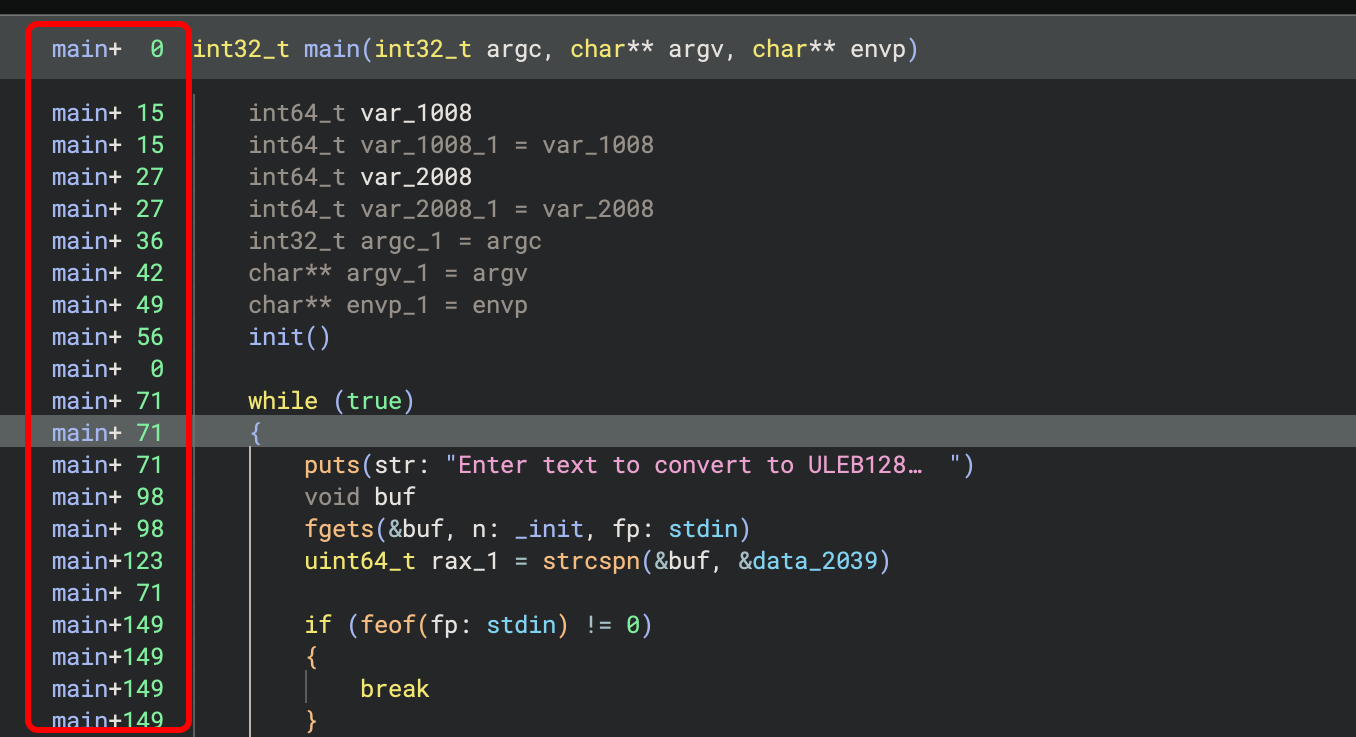
Often shown in debugger context readouts like gdb with pwndbg, function start-relative
addresses are also an option. For example, these offsets are rendered relative to the
function start, and as decimal numbers, to match the style shown by GDB:
From Fixed Base Address
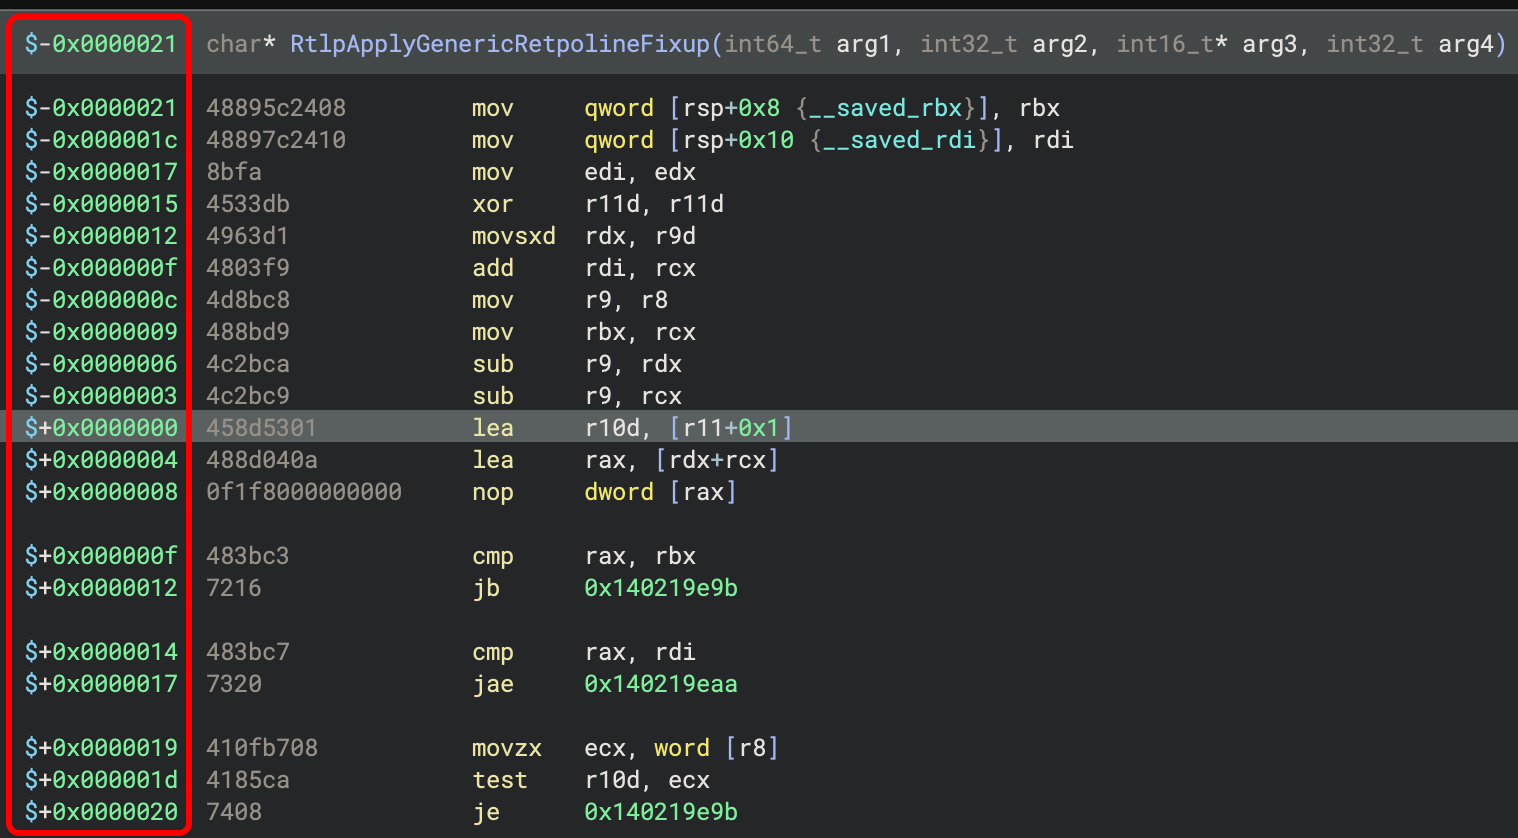
If you are working with a leaked pointer to an instruction, you can set it as the base address and all other lines will be shown relative to it. This makes it very convenient to calculate potential call targets without needing to first calculate the base address. For example, these offsets have been marked as starting from the highlighted line, and every other line’s address is shown relative to it:
Relative Addresses in the Stack View
In a similar design, the Stack View also benefits greatly from being able to move the point from which the line offsets are displayed. This can be very useful when dealing with i386 binaries that like to make lots of changes to the stack pointer and then do math based on those changes.
Relative to a Base Register
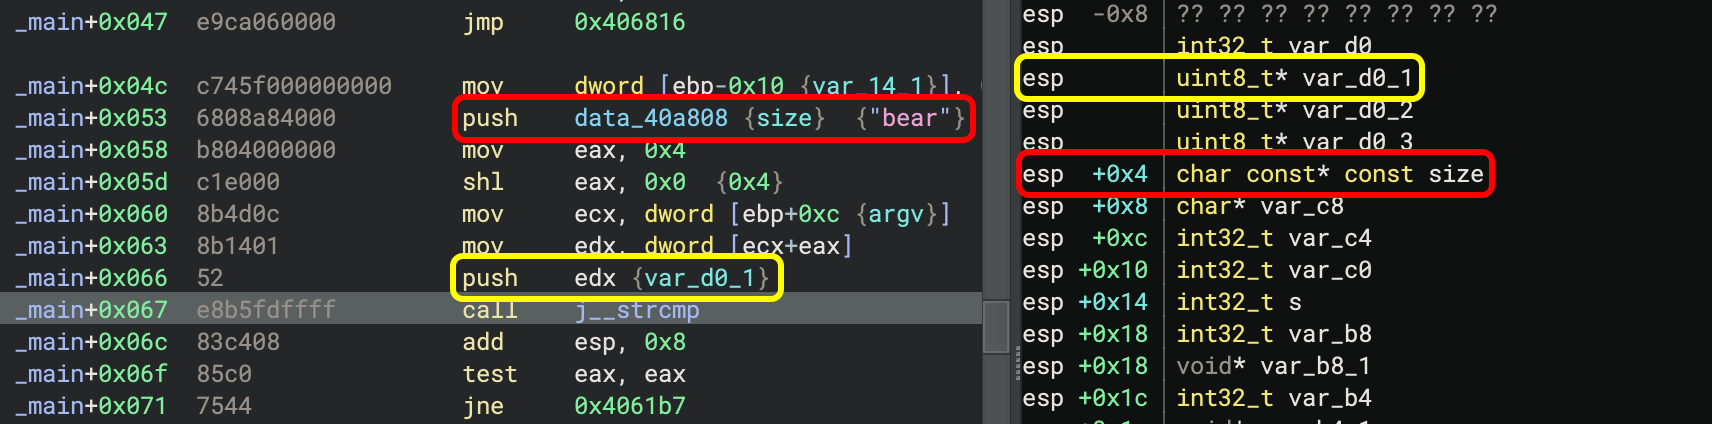
Most binaries make adjustments to the stack pointer during the course of a function, and
if you want to see both where a register is pointing and at what offset the stack variables
are from the register, you can now do so. For example, you can see these two push instructions
reflected by the shifted value of esp and their variables locations in the stack view:
The offsets will follow the instruction you highlight and update if the stack pointer
changes. Note that offsets shown are from before the instruction executes, so
instructions that modify the stack pointer will be reflected on the next instruction’s
line. Watch as the push instructions affect the representation of the stack pointer
in the stack view:
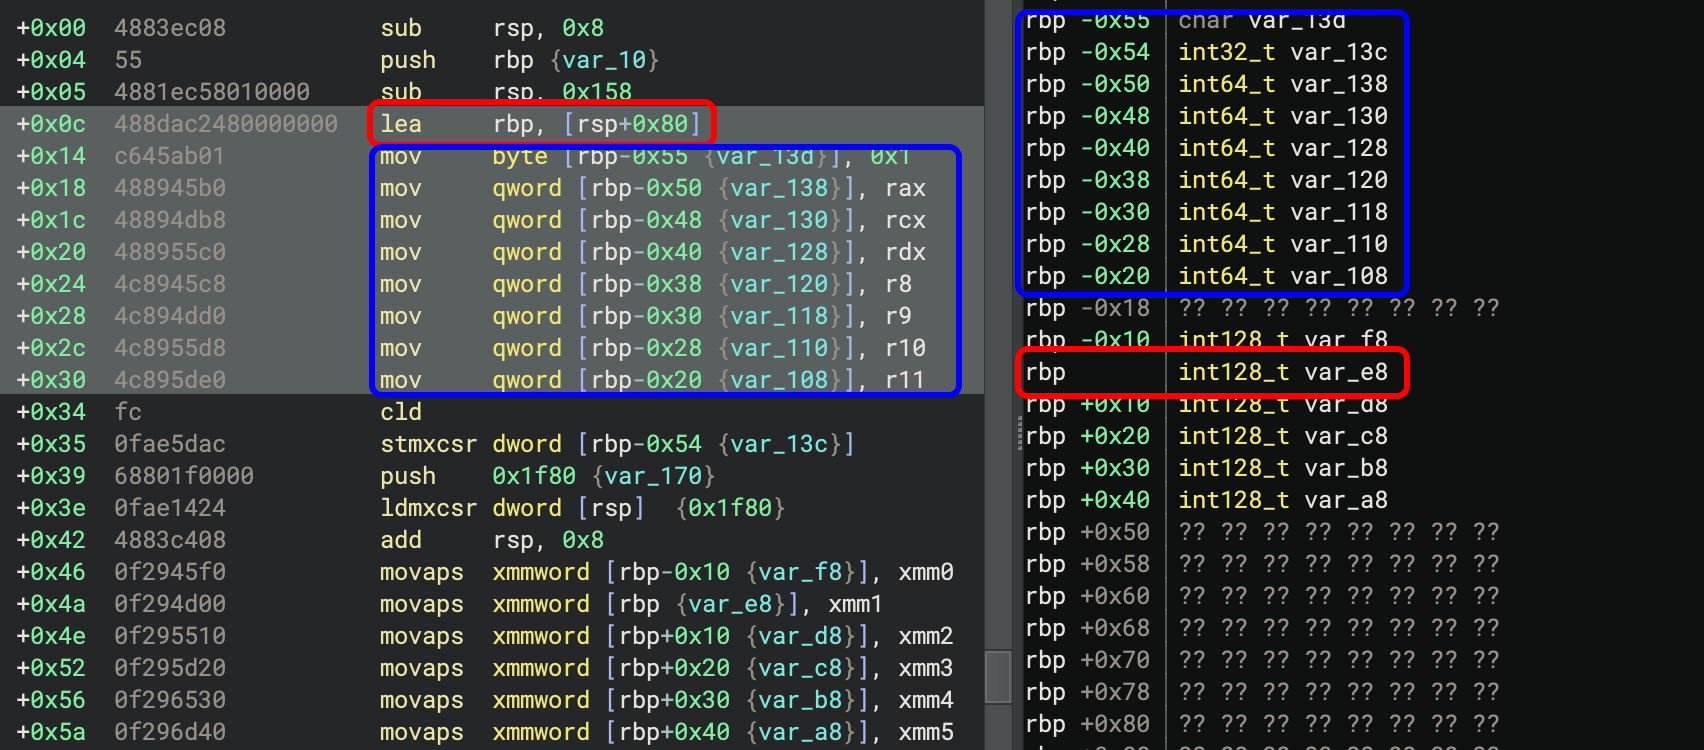
This is especially useful for locating variables from text in disassembly. For example,
if you see lea rbp, [rsp+0x80], you can set the base register to rbp and find the variables
at offsets from that structure at rbp. These rbp-relative addresses are negative, and
you can easily spot them in the stack view:
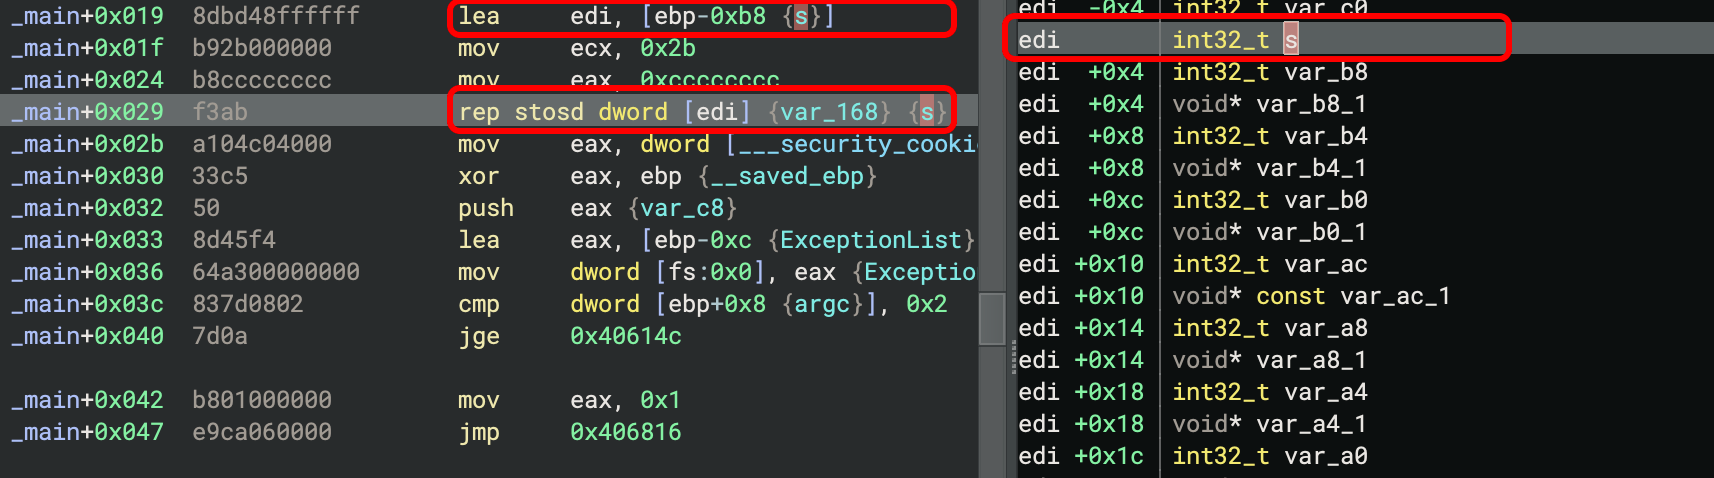
If the function ever takes the address of stack memory into a register, you can also base
Stack View on that register and see the relative offset of other stack variables from there.
Only registers pointing to the stack are supported currently, such as this example where
edi is assigned an offset relative to ebp, and now you can see exactly which parts of
the stack that the rep stosd will affect:
Relative to a Base Offset
A more interactive option than using a register base, you can double-click any line on the
offset column and use that line as the base, with all other lines displayed relative to it.
This is especially useful if you know you have a stack smash of a particular variable, and
want to know the offsets of other variables on the stack, like the return address. Watch as
calculating the stack smash size for this (admittedly trivial) gets overflow is as easy
as double-clicking the stack variable and reading the offset of the return address:
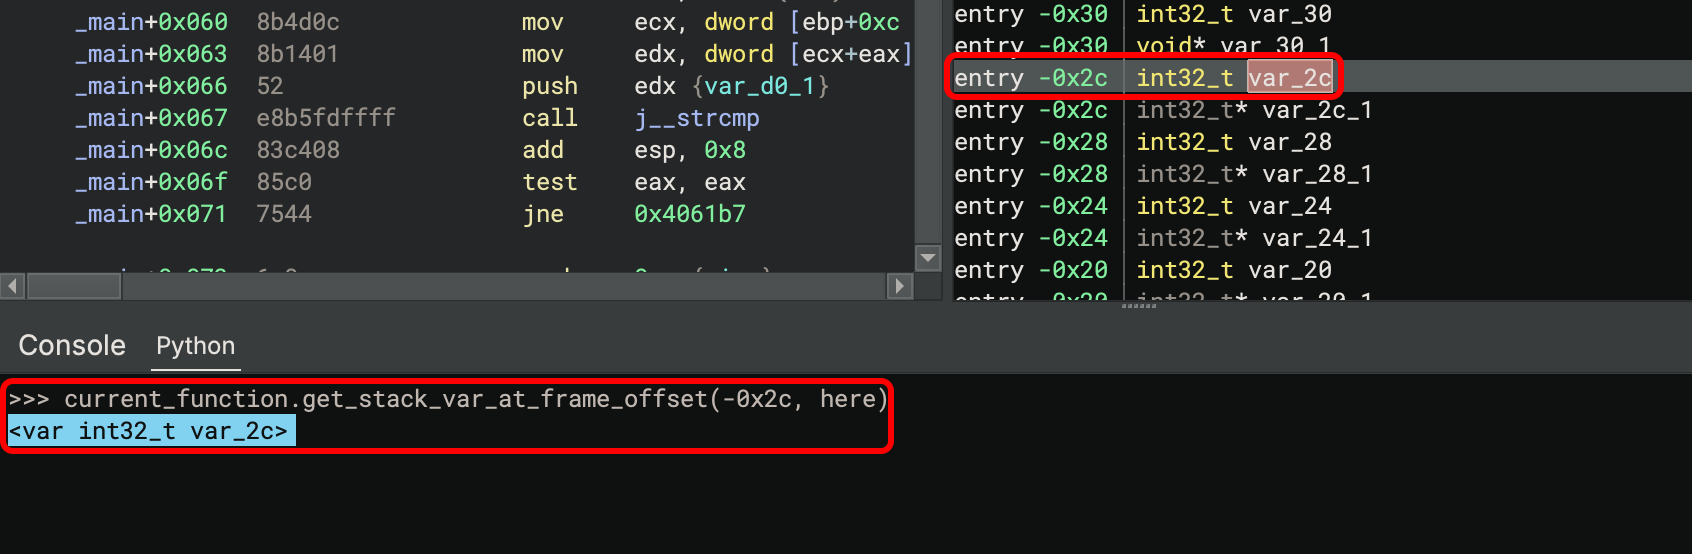
Relative to the Entrypoint Stack Pointer
Still the default rendering display, and how the Stack View worked previously, stack frame variables are shown at offsets from the value of the stack pointer on function entry. Most calling conventions start by immediately allocating stack space and setting up a stack base pointer register, while moving the stack pointer down to the end, making this view useful mostly for displaying consistent offsets and scripting. If any of the previous offset modes are unable to be calculated (for example, if the stack pointer register is used for other purposes) this mode is the fallback mode which will be rendered instead. You can see here how the API returned a name similar to the offsets the stack view is displaying:
Try it Yourself!
You don’t have to wait for the stable release of Binary Ninja 4.1 – current customers can download the latest builds from the development branch and try out these updates today!