In this post, I will explain how I analyzed the Serpentine challenge in this year’s flare-on with the help of time-travel debugging (TTD) integration in the Binary Ninja debugger.
Serpentine is the 9th challenge and is commonly considered the hardest among the ten challenges this year, or even among ALL recent years. It features self-modifying code, x64 exception handling and unwinding, and arithmetic operations masquerading as table lookups. It is a fantastic challenge and a great test of the player’s skills and their tool’s reliability. I’m glad that I was able to solve it and also complete this year’s flare-on challenge!
I used TTD as an initial overview to explore the swamp of obstacles. If you have not heard of it yet, TTD is a technology that allows the recording and replay of the execution of a target. This could be a user process or even a whole system. TTD offers an unprecedented advantage to reverse engineering since it enables traveling back and forth in time and allows the examination of previous states of the target. Among the various TTD solutions, WinDbg TTD is free to use and supports the recording of Windows user-mode processes.
Binary Ninja’s debugger integrates WinDbg TTD support so you can record a TTD trace and replay it using a familiar user interface.
So much for the background, let’s get started!
Initial Analysis
The main function looks deceptively simple:
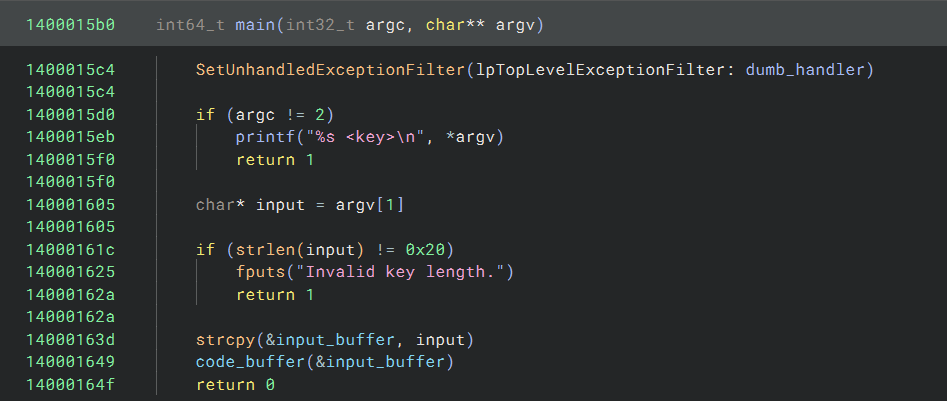
The input string must be supplied on the command line, and it must be 0x20 chars long. After these checks, a code
buffer is executed with the input string as the first argument.
There is also nothing fancy going on with the code buffer. The _TLS_Entry_0 function allocates a RWX buffer and
copies some 0x800000 bytes from the .data section into it:

However, when I try to disassemble the code buffer, it gives me a surprise that the first instruction is hlt:

This instruction will cause an exception which needs to be handled. This is quite common in flare-on or other CTFs,
and I quickly noticed that there is a call to SetUnhandledExceptionFilter at the beginning of the main function.
To my disappointment, the exception handler is dumb and doesn’t do anything:

I was stuck because I couldn’t figure out how the exception works. I ran the program with an input that
are 0x20 bytes long (abcdefghijklmnopqrstuv0123456789) and it printed an error message Wrong key, which means the
exception is somehow handled and the code execution continues, though I wasn’t sure how that works.
I decided to analyze it with TTD to see if I could make some progress.
TTD Recording
Before recording a TTD trace, you must first get WinDbg/TTD installed. For licensing reasons, we
don’t bundle WinDbg as part of Binary Ninja. But the installation process is automated – just click
Debugger -> Install WinDbg/TTD in the menu, and a Python script will download the relevant files and install them for
you. If, however, you are running the Binary Ninja offline or using the free version, you will need to install it
manually.
Once the installation is completed, relaunch Binary Ninja, and click Debugger -> Record TTD Trace in the
menu. In the TTD Record dialog that pops up, make sure the parameters including the executable path and command line
arguments, are correct:
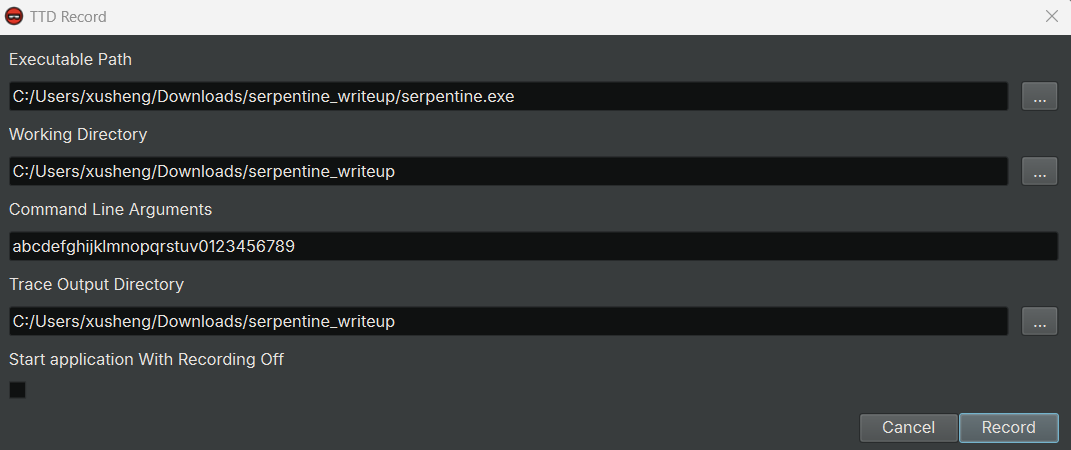
After clicking the Record button, a Windows UAC dialog will pop up and ask for Administrator privilege. This is
because the TTD recorder command line utility requires it to function properly. Once you click Yes on it, the recording
starts. The duration of the recording varies from different targets, but for this binary, it finishes almost
instantaneously.

I got two files in the output directory. serpentine01.run is the actual trace file and is 36.0 MB in size, which is
quite impressive for what it’s doing! serpentine01.out is text output from the recorder command line
utility that might be useful for troubleshooting.

Replaying TTD Trace
To replay the recorded TTD trace, I opened the Debug Adapter Settings dialog, and made the following changes:
- Select
DBGENG_TTDas theAdapter Type - Change the
Executable Pathto the path of the trace file, i.e.,serpentine01.run
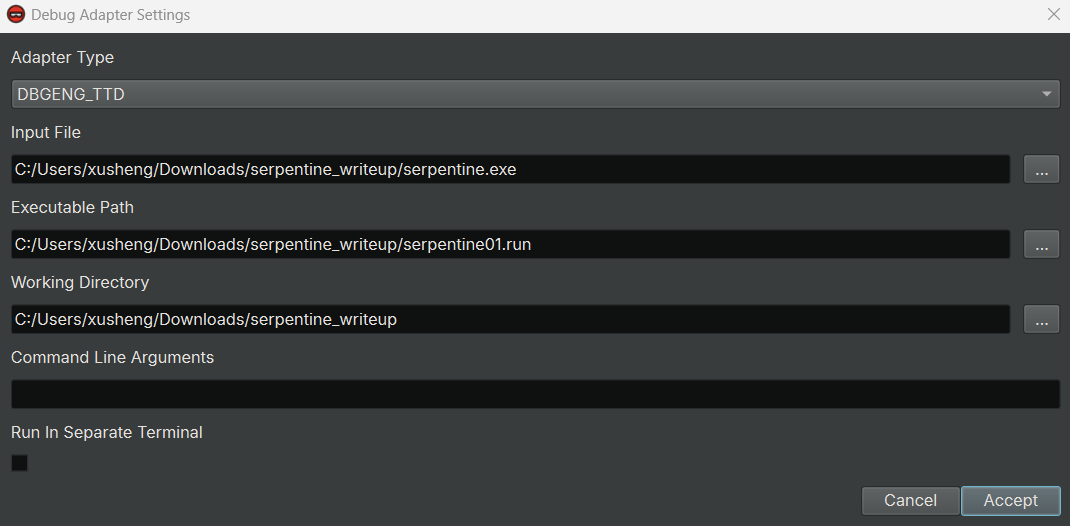
I first clicked OK to accept the above changes, then clicked Launch to start debugging as usual.
When I replayed the TTD trace for the first time, the trace was indexed and took longer than future replays. I got the following output:
Time Travel Position: B:0 [Unindexed] Index
Indexed 3/3 keyframes
Successfully created the index in 360ms.
Breakpoint 0 hit
*** WARNING: Unable to verify checksum for serpentine.exe
Time Travel Position: 13:19
serpentine+0x1a14:
00000001`40001a14 4883ec28        sub     rsp,28h
An index file – serpentine01.idx also showed up in the same directory where the trace file is. For larger trace
files, there will be more keyframes in it, and the indexing process can take a while. The good news is this only needs
to be done once and later accesses to the trace are quite fast.
Now I was ready to see how the exception generated by the hlt instruction was handled. I first put a breakpoint on
the instruction that calls into the code buffer and stepped into it. Now I was at the hlt instruction and stepped
again. A bit to my surprise, I was actually on the next instruction immediately after the hlt instruction:
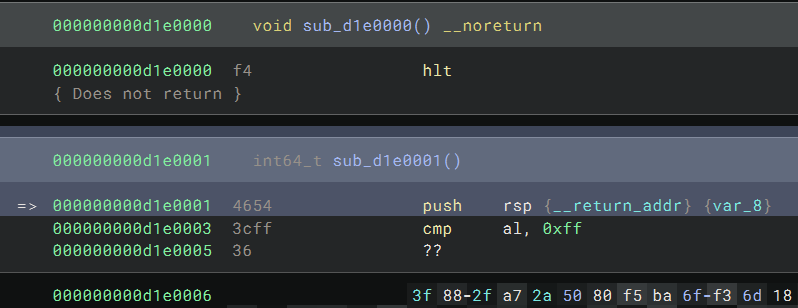
But I quickly realized that this doesn’t mean the push rsp instruction is executed. This is just an artifact of how
the exception works at the CPU level and how the TTD recorder handles it. Technically, since hlt instruction is a
privileged instruction and executing it will trigger a general protection (GP) fault, the instruction pointer shouldn’t
have advanced to the next instruction. The recorder causes a bogus instruction to be recorded in the trace.
I stepped once more and got to the start of KiUserExceptionDispatch, which is an important piece in Windows’s
exception handling process. Now I can confirm the exception indeed somehow is handled, but I still had no clue how.

After being stuck here for a while, I realized that I could not only debug the trace, but I could run queries on it and see which instructions had been executed in the code buffer!
Debugger Data Model and Queries
In my opinion, the debugger data model is the real gem of TTD. I do admit that having the ability to travel in both directions of the trace is a powerful addition to regular debugging, but it only gets you so far and doesn’t unleash the full potential of TTD.
To make it more tangible, think of the case where you wish to check the coverage of the code from a TTD trace. Of course, the information of all the executed instructions is in the trace, but it could become a problem if you have to extract them one by one. Specifically, you might try to repeatedly single-step on the trace and record what has been executed. However, that will descend into serious performance issues on a moderately sized trace.
The debugger data model allows us to run SQL-like queries on the trace. The model exposes the following valuable artifacts for query:
- Memory read/write/execute
- Function calls
- Processes and threads
- Heap
- Modules
- Exception and events
For this particular challenge, I wanted to see which instructions are executed in the code buffer. This can be answered by a query on the Memory object:
dx -g @$cursession.TTD.Memory(0xd1e0000, 0xd9e0000, "e")
It doesn’t look too complex, right? The first two parameters specify the start and end address of the memory area
to include in the query, and I supplied the start and end address of the code buffer. The next parameter
specifies the access type for the query. I used e, which not-so-surprisingly, stands for execution. Putting these
together, this query returns all the instructions that have been executed in the range 0xd1e0000-0xd9e0000.
I can execute this query within Binary Ninja’s GUI since the Debugger console connects directly to the
WinDbg/DbgEng engine:
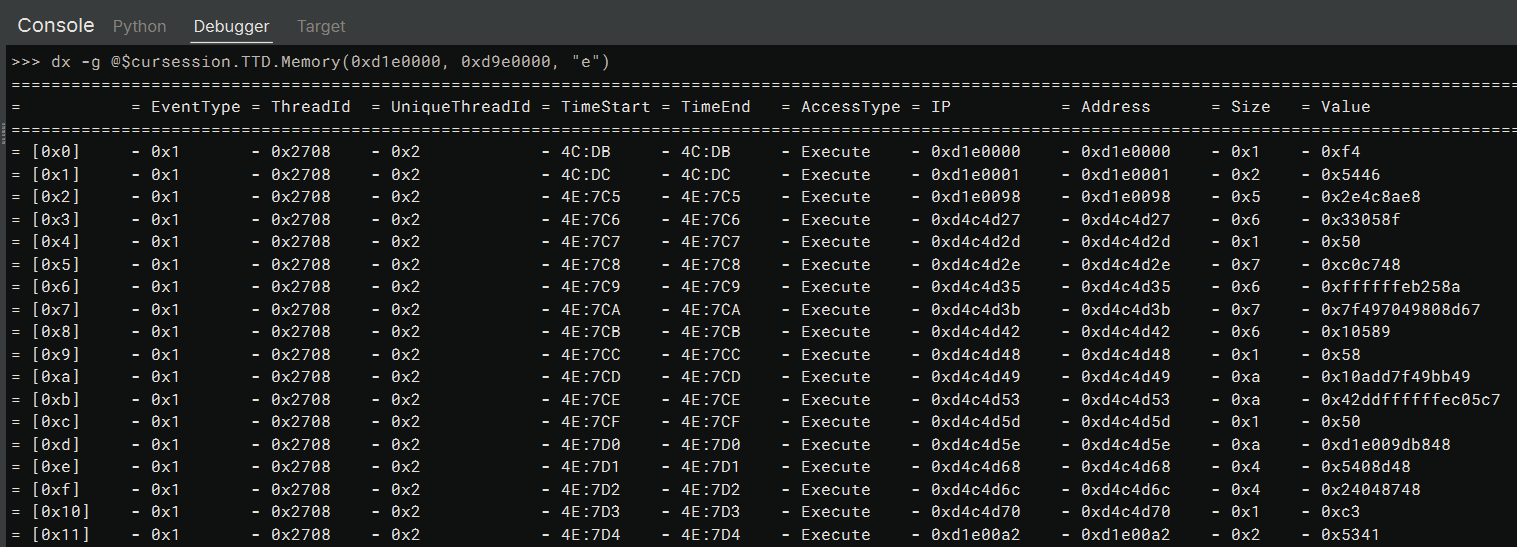
The output should be pretty self-explanatory; each row stands for an instruction that has been executed, and the columns are information about it. For example, it includes the address and bytes of each executed instruction. For a detailed description of the information, please refer to the documentation.
From it, I can see the next instruction after the hlt instruction is at 0xd1e0098, with
a start time 4E:7C5. This start time is a Position
object, and I can time-travel to it directly by issuing the command !tt 4E:7C5 in the Debugger console.
The debugger would switch to the state at that particular timestamp. The ability to teleport in the timeline is the
main feature that makes TTD magical.
There is a function call at 0xd1e0098 and the code inside it looks like:
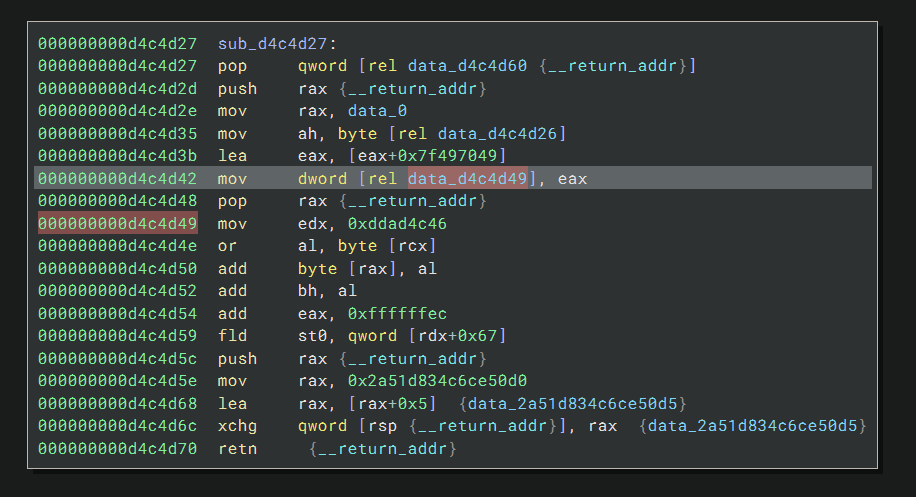
To my trained eye, the code is self-modifying, that the instruction at 0xd4c4d42 overwrites the byte at
0xd4c4d49. This means the mov edx, 0xddad4c46 instruction currently at 0xd4c4d49 will be changed to something
else right before it is executed. I single-stepped a few times and then reached:
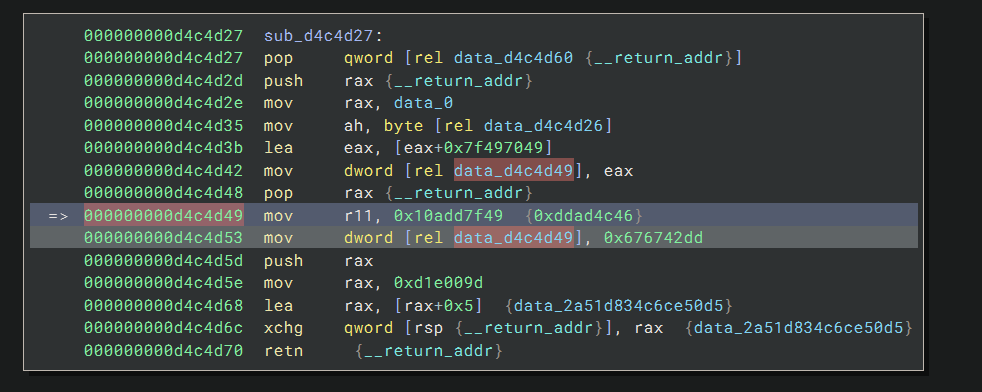
Now I can see the actual instruction is mov r11, 0x10add7f49, and another instruction will change the contents of
the bytes back to the original value right after it gets executed. This prevents us from easily dumping the contents of the
instruction.
I spent some time exploring the trace and realized that this self-modifying pattern is used across the trace. Every instruction is encrypted in this way, and I’m not getting anywhere unless I figure out a way to automate the process of extracting them.
Javascript Automation
Since the instruction we want is written to immediately before it gets executed, I figured I simply need to dump all
the memory writes and instruction executions within the code buffer, and write a small script to harvest the
ones I’m looking for. This can be seen by running the previous query with ew as the third parameter, which makes
it include both memory writes and instruction execution. We can see the write-execute-write pattern on
address 0xd4c4d49:

The debugger data model comes with a Javascript API. I’m not a big fan of Javascript, so I ended up first using Javascript to dump the required information into a file and then using a separate Python script to do the actual hunting. You could also do it with one script if you prefer JavaScript.
I modified 0vercl0k’s codecov.js to get the following:
const logln = p => host.diagnostics.debugLog(p + '\n');
const hex = p => p.toString(16);

function DumpQuery() {
    const CurrentSession = host.currentSession;
    const Utility = host.namespace.Debugger.Utility;

    const FilePath = "C:\\Users\\xusheng\\Downloads\\serpentine_writeup\\output.txt";
    logln('Writing ' + FilePath + '...');
    const FileHandle = Utility.FileSystem.CreateFile(FilePath, 'CreateAlways');
    const Writer = Utility.FileSystem.CreateTextWriter(FileHandle);

    const BaseAddress = 0xd1e0000;
    const Size = 0x800000

    const CoverageLines = CurrentSession.TTD.Memory(
        BaseAddress,
        BaseAddress.add(Size),
        'WE'
    );

    for (var line of CoverageLines)
    {
        Writer.WriteLine(line.TimeStart + "\t" + line.AccessType + "\t" + hex(line.IP)
            + "\t" + hex(line.Address) + "\t" + hex(line.Size) + "\t" + hex(line.Value));
    }

    FileHandle.Close();
    logln('Done!');
}

function initializeScript() {
    return [
        new host.apiVersionSupport(1, 2),
        new host.functionAlias(
            DumpQuery,
            'dumpquery'
        )
    ];
}
This script registers a command dumpquery which will run the DumpQuery function. It executes the same query we
mentioned above with the CurrentSession.TTD.Memory object, and for each object within the result, prints the start
time, access type, instruction pointer, address, size, and the value. The instruction pointer can be different from
the address when the access type is Write – the instruction pointer is the address of the instruction itself, and
the address is the address of the byte that the instruction writes to.
To run this script, I first ran the .loadscript command:
.scriptload C:\Users\xusheng\Downloads\serpentine_writeup\dumpquery.js

JavaScript script successfully loaded from 'C:\Users\xusheng\Downloads\serpentine_writeup\dumpquery.js'
Now that it loaded fine, I invoked the command with:
!dumpquery

Writing C:\Users\xusheng\Downloads\serpentine_writeup\output.txt...
Done!
@$dumpquery()
Thanks to the debugger console, I can run these WinDbg commands all within Binary Ninja. You can also open the trace file in WinDbg and do the same thing.
Patching and Deobfuscation
Now that I have all the information, I started to write a script to patch the code and remove the self-modification code. As a brief recap, the code uses the following pattern for each instruction:
- A function call into a short snippet of code
- Inside the function, the real instruction is decrypted, executed, and re-encrypted
- The return address is manipulated to point to the next code blob
- The function returns to the designated address
- Repeat
My plan is as follows:
- Patch the code to replace the call instruction with a jmp. It jumps to the very address of the real instruction
- Replace the encrypted bytes with the actual bytes of the instruction
- Find the real return address, and insert another jmp to it right after the real instruction
In this way, we chain the real instructions together with jmp instructions. I’m a bit shy to include my script in this blog since it was written in a rush and surely looks ugly. I put it in this gist for those curious. The only interesting part of the script is that it pinpoints the real instructions by scanning for the write-execute-write pattern.
Here are my results. We can already get a clue of what the code looks like roughly:
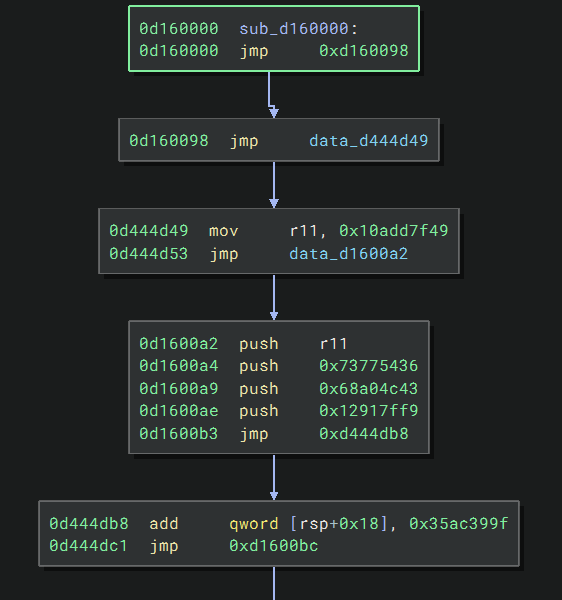
That code immediately reminded me of exception handling:
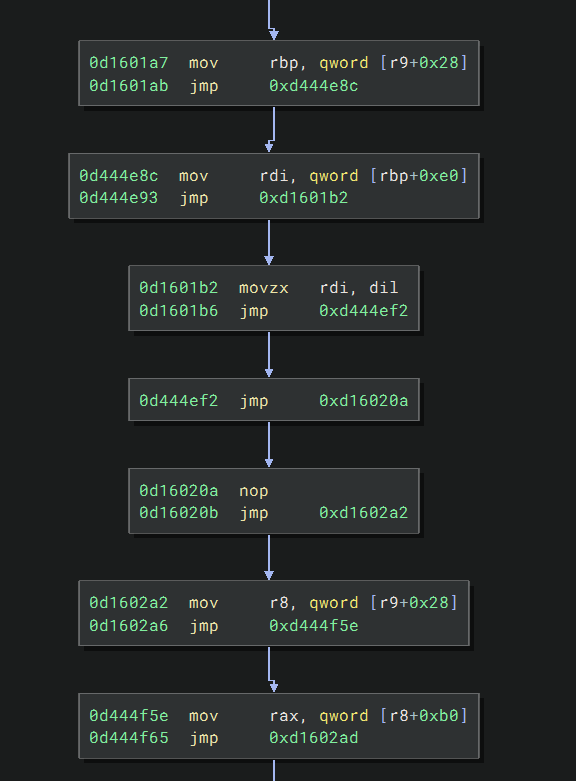
If we check the definition of
EXCEPTION_ROUTINE,
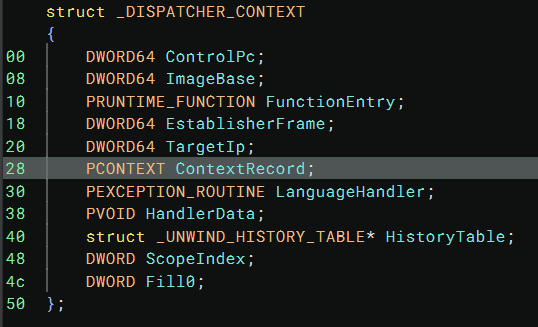
we can see r9, as the fourth argument, should hold a DispatcherContext:
typedef EXCEPTION_DISPOSITION (*PEXCEPTION_ROUTINE) (
    IN PEXCEPTION_RECORD ExceptionRecord,
    IN ULONG64 EstablisherFrame,
    IN OUT PCONTEXT ContextRecord,
    IN OUT PDISPATCHER_CONTEXT DispatcherContext
);
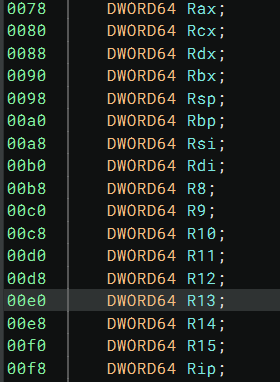
Inside a DispatcherContext, the object at offset 0x28 is ContextRecord, which contains all the registers saved
when the exception happens:
So, for code
mov rbp, qword [r9+0x28]
mov rdi, qword [rdi+0xe0]
It only does one thing, loading the value of the r13 register (before the context save) into the rdi register. This
makes sense, since the exception will clobber many registers, making the continuation of code execution hard. Using
this clever trick, the author can move the registers around and implement the desired code logic.
To keep this blog post short and focused on TTD, I’ll stop the analysis here since there is still quite a bit of a journey ahead to arrive at the flag. As a brief recap, TTD helped me analyze and understand the code in a way that traditional debugging would be hard-pressed to. If you are interested, you should definitely try it out yourself!