Decompilation is an incredibly complicated process with a huge number of optimizations, analyses, and transformations happening behind the scenes. Luckily, Binary Ninja has many advanced features that expose access to this internal information. Whether it’s across the ILs, analysis, or the type system, there are tools built in to help display how things work. Not only do we use them internally, but you can leverage them as well to save time and gain understanding! Read on to learn about some of the features that exist for exactly this purpose.
High Level IL Debug Report
Binary Ninja has a built-in visualization tool for inspecting the steps in the creation of High Level IL (HLIL), and it has been instrumental in helping us build and maintain our decompiler. Check out how the various stages work together to produce the final output:
You can view the High Level IL Debug Report on your own binaries using the Python command, current_function.request_debug_report("hlil"). If you find yourself opening it often, you can use the Snippets plugin to register it as a UI Action with a hotkey. In fact, it’s one of the example scripts included with the plugin, and can be downloaded by running the update snippets script.
Low Level IL: Show Stack Pointer Value
Sometimes analysis runs into problems when branches have diverging Stack Pointer offset values. Either due to anti-analysis obfuscations or incorrectly predicted function call stack adjustments, having a mismatched Stack Pointer leads to incorrect lifting and confusing output. Binary Ninja has a visualization mode built into Low Level IL which is designed to help resolve these errors. For example, here is a function intentionally causing the Stack Pointer to change in a branch that is never taken:
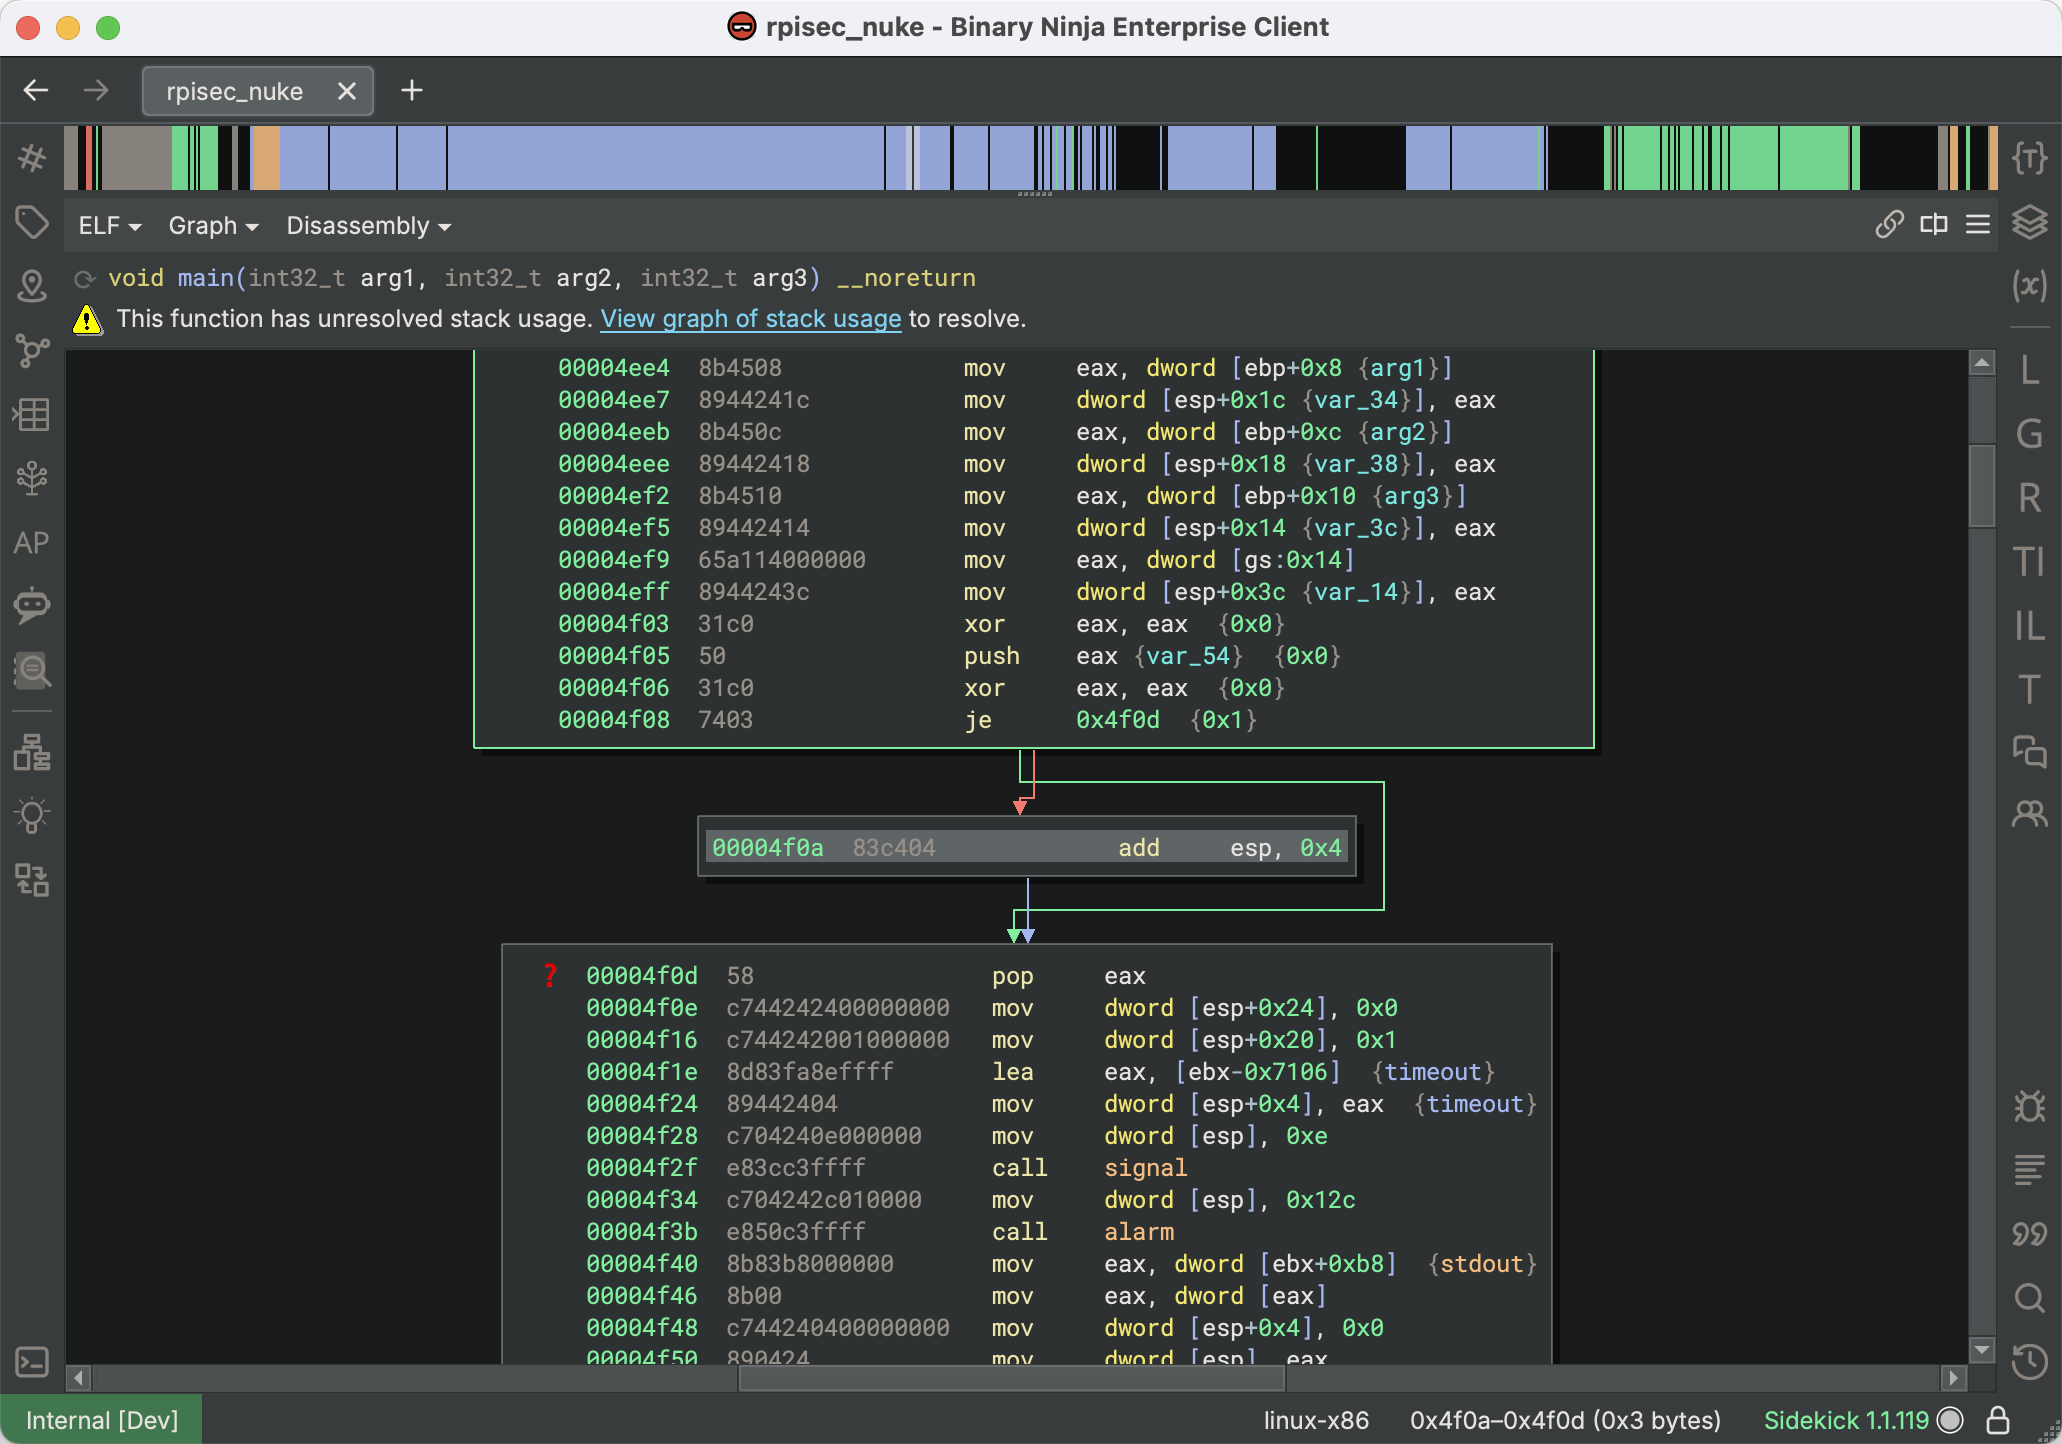
In the disassembly, you can see a “?” tag placed on the continuation block, indicating that Stack Pointer analysis could not resolve the diverging offsets. If we switch to Low Level IL, we can enable Show Stack Pointer Value (from the View Options menu > Advanced sub-menu). This will add annotations to every instruction that modifies the Stack Pointer value, allowing you to observe where the values diverge:
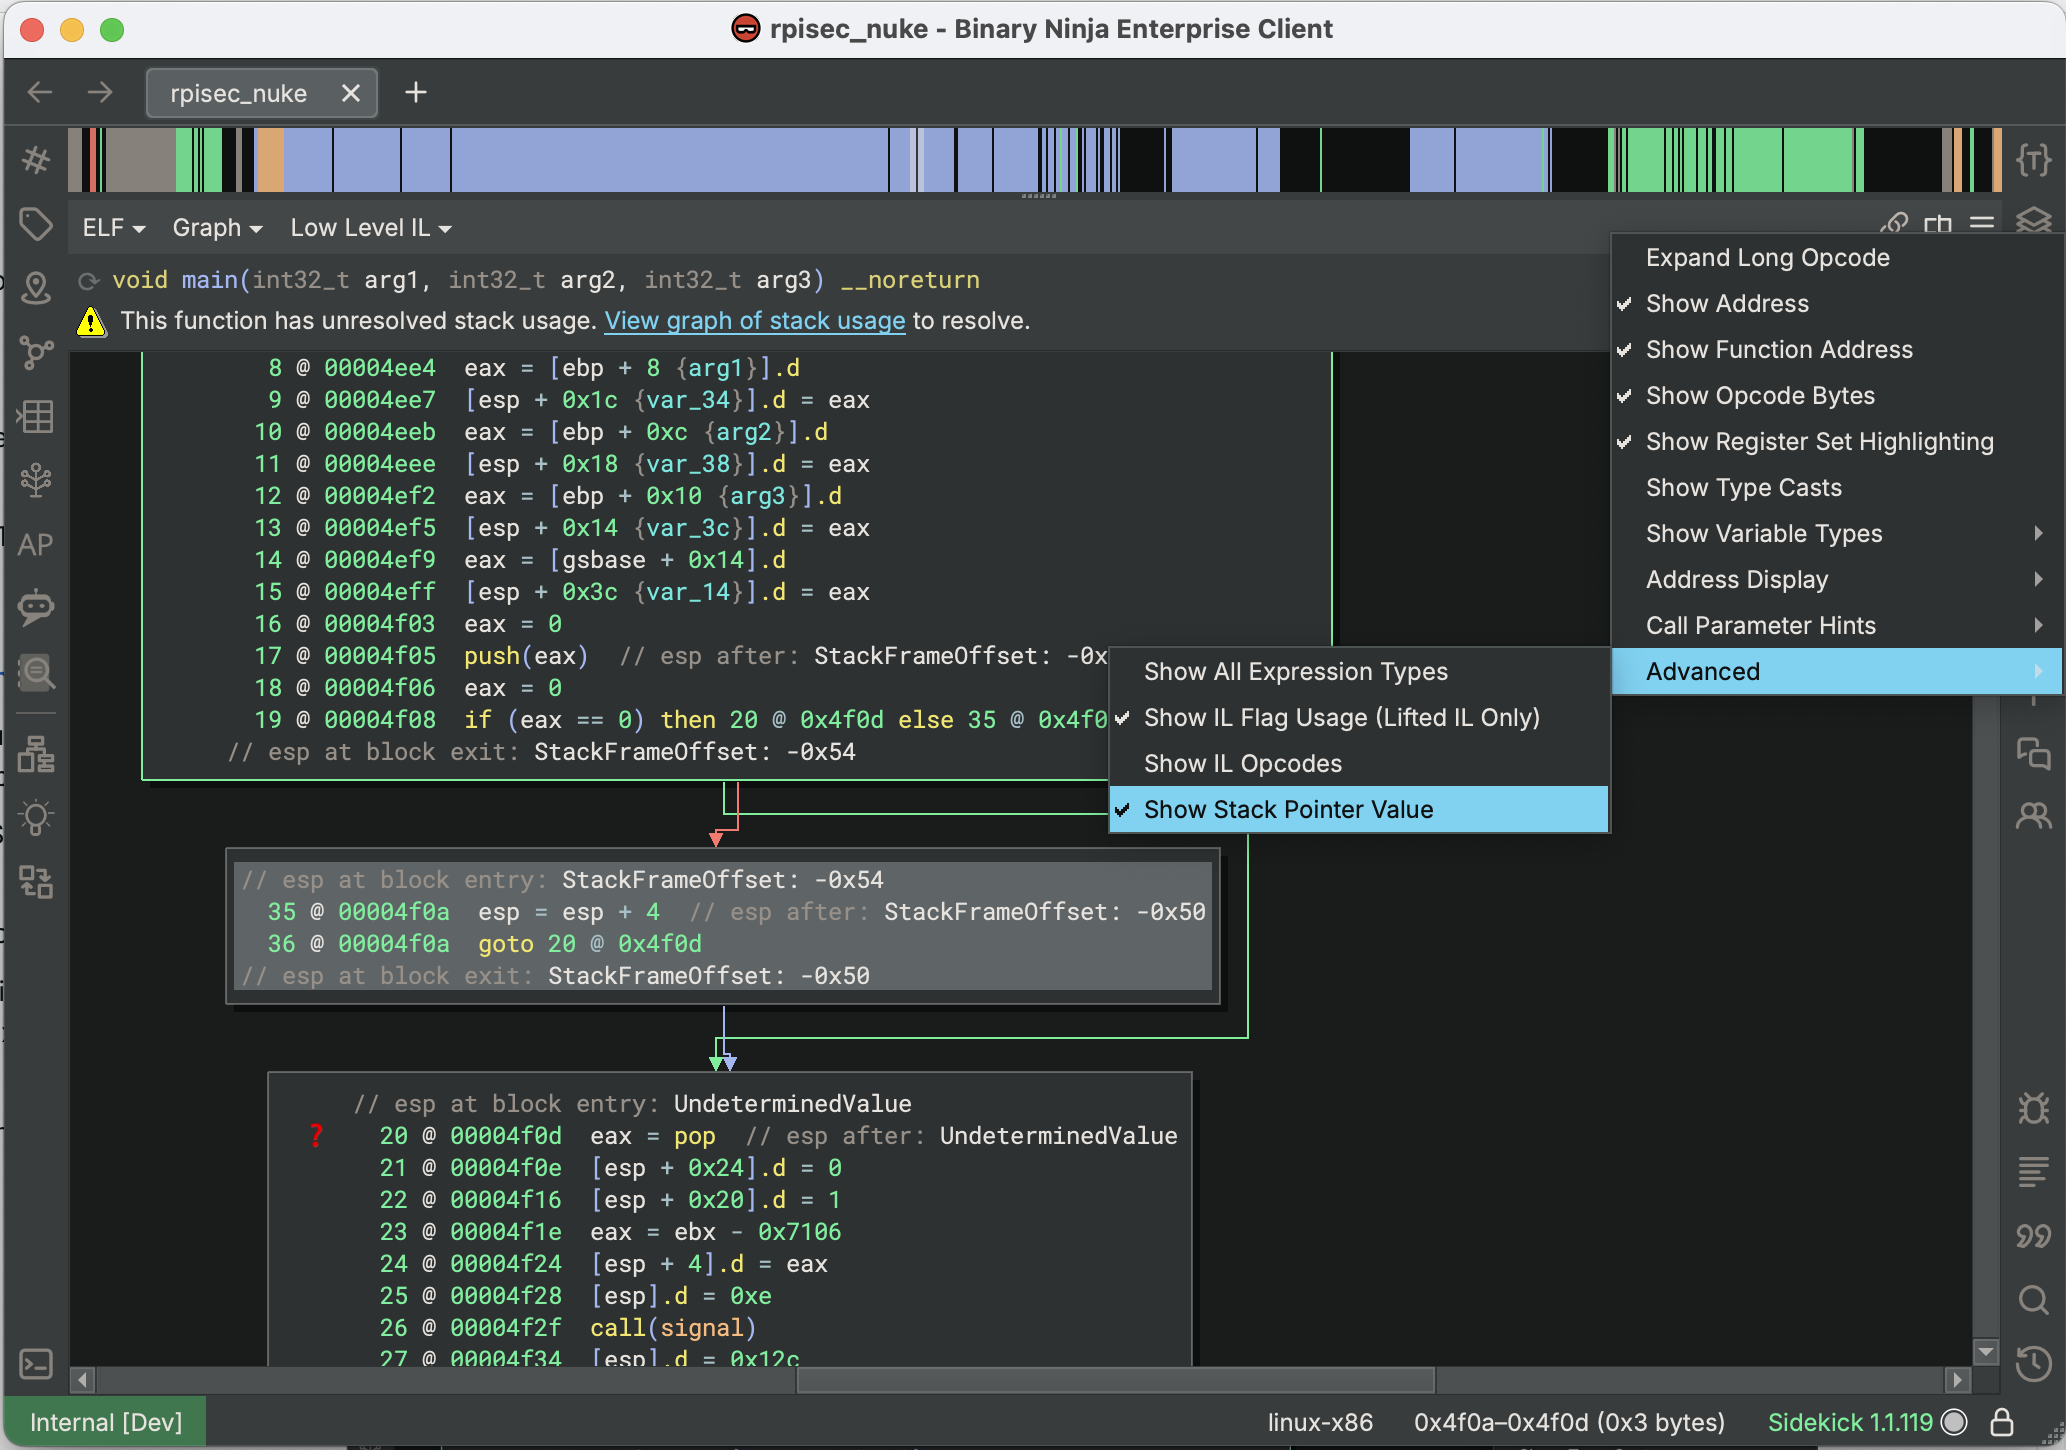
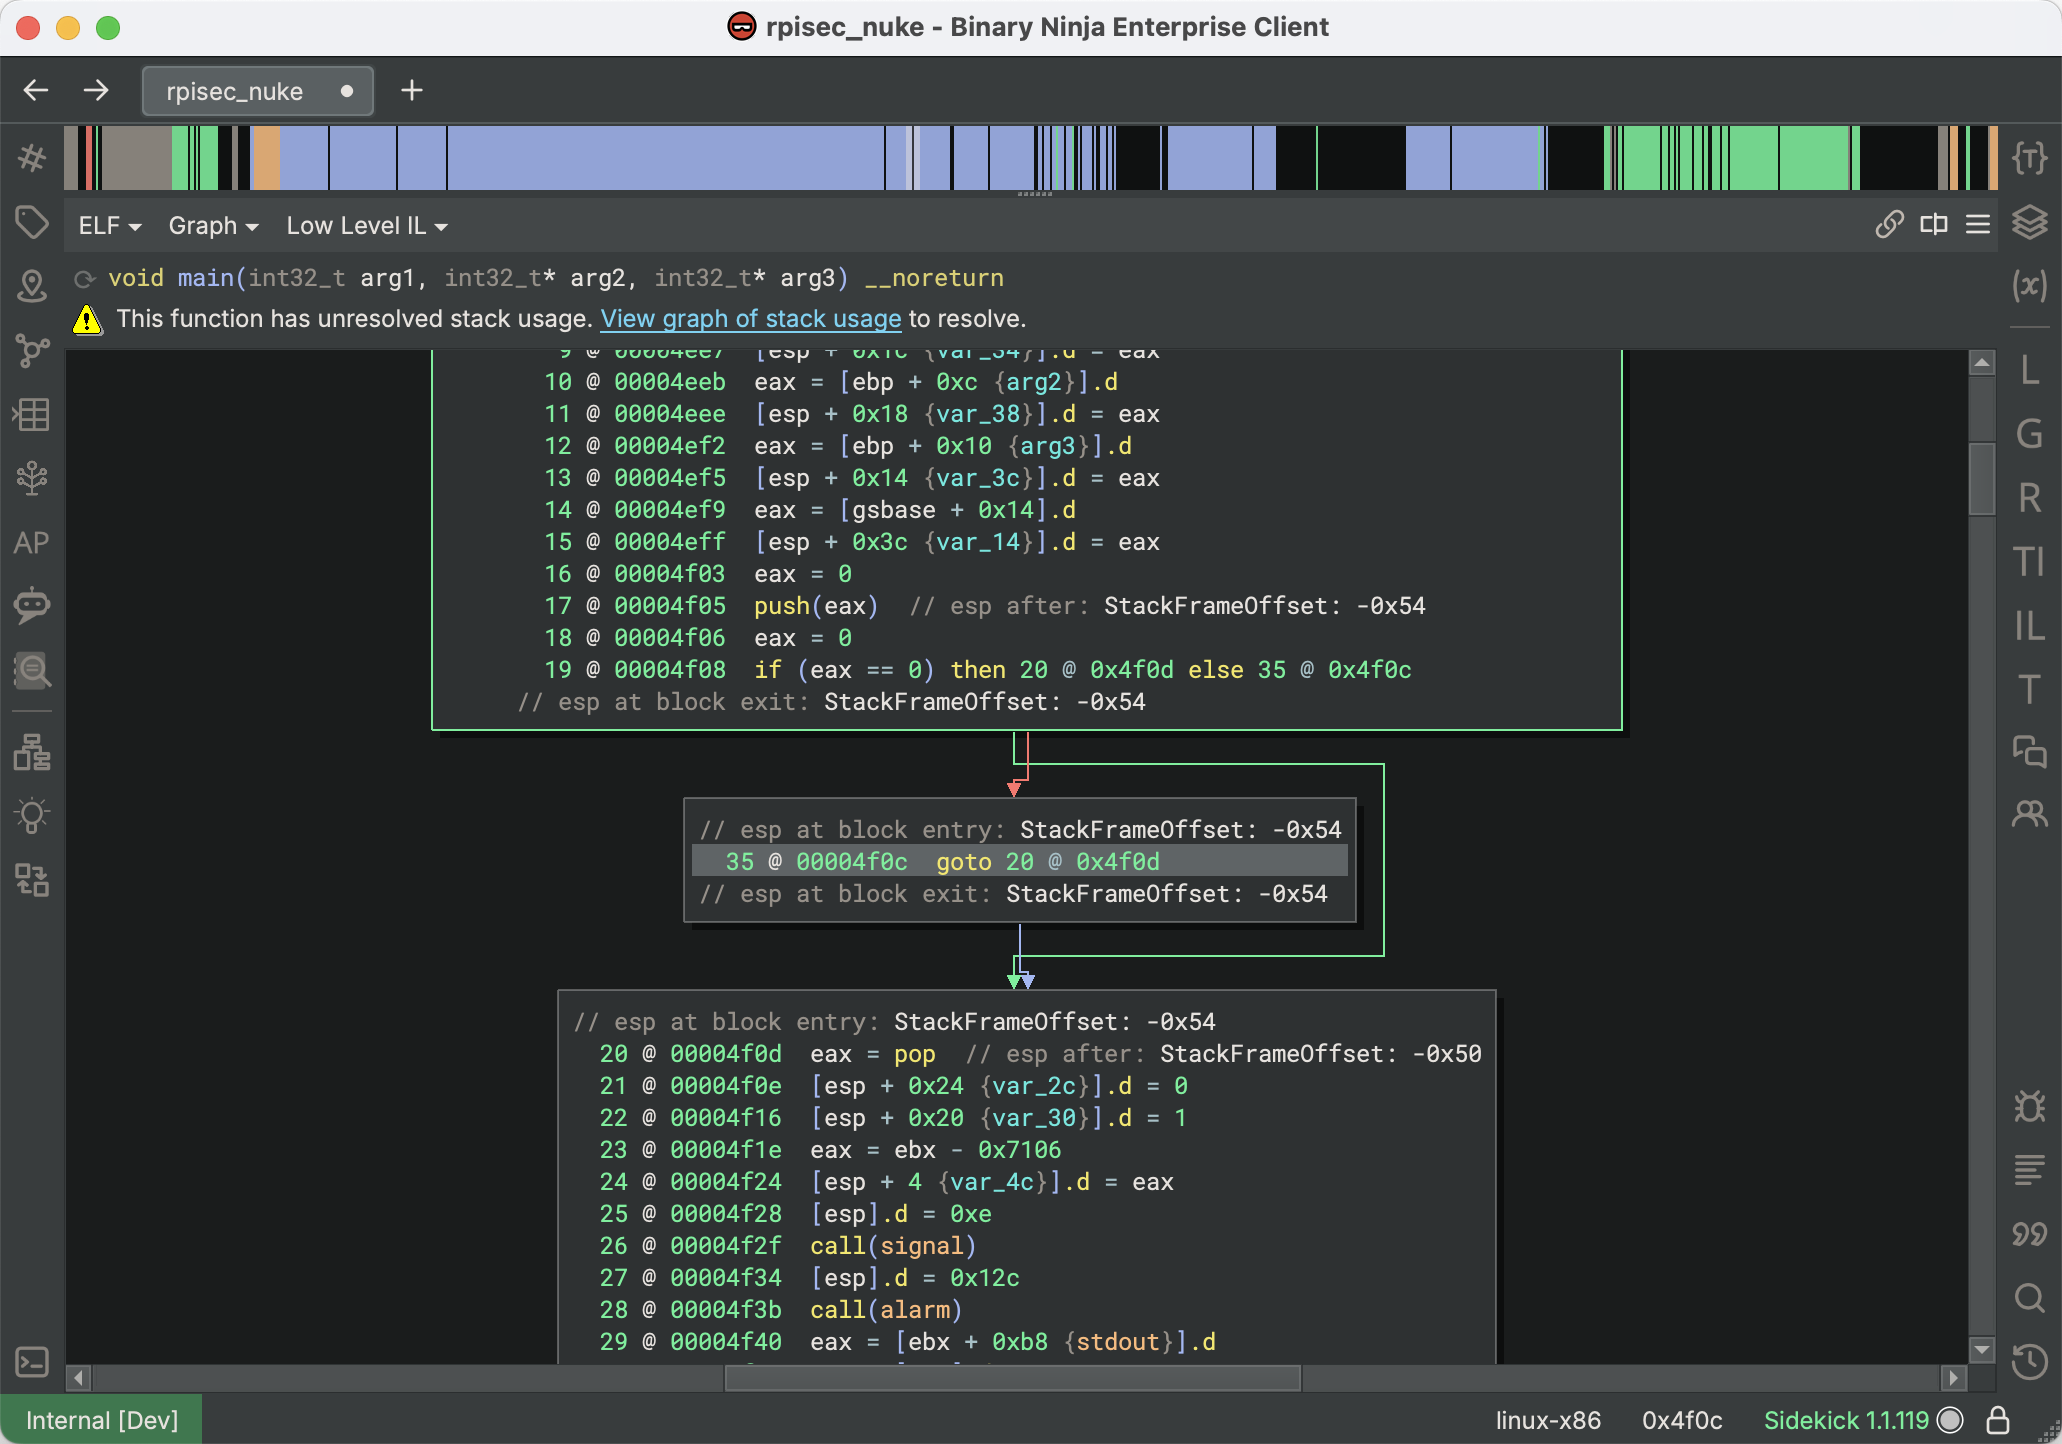
You can observe how the incoming edges to the block at 20 @ 00004f0d have esp values of both StackFrameOffset: -0x54 and StackFrameOffset: -0x50 due to the rogue esp = esp + 4 anti-analysis feature. Using this information, you can use the “Patch > Convert to NOP” action on that instruction, allowing Stack Pointer analysis to succeed at this location and propagate further:
Note that sometimes this will occur within loops, and the incoming Stack Pointer values will both be UndeterminedValue. When this happens, it’s often helpful to look for the “Unresolved Stack Pointer Value” tags created on any blocks where the incoming Stack Pointer offsets diverged, even if the final result was undetermined. There is also another feature you can use in complicated situations…
Stack Adjustment Graph Debug Report
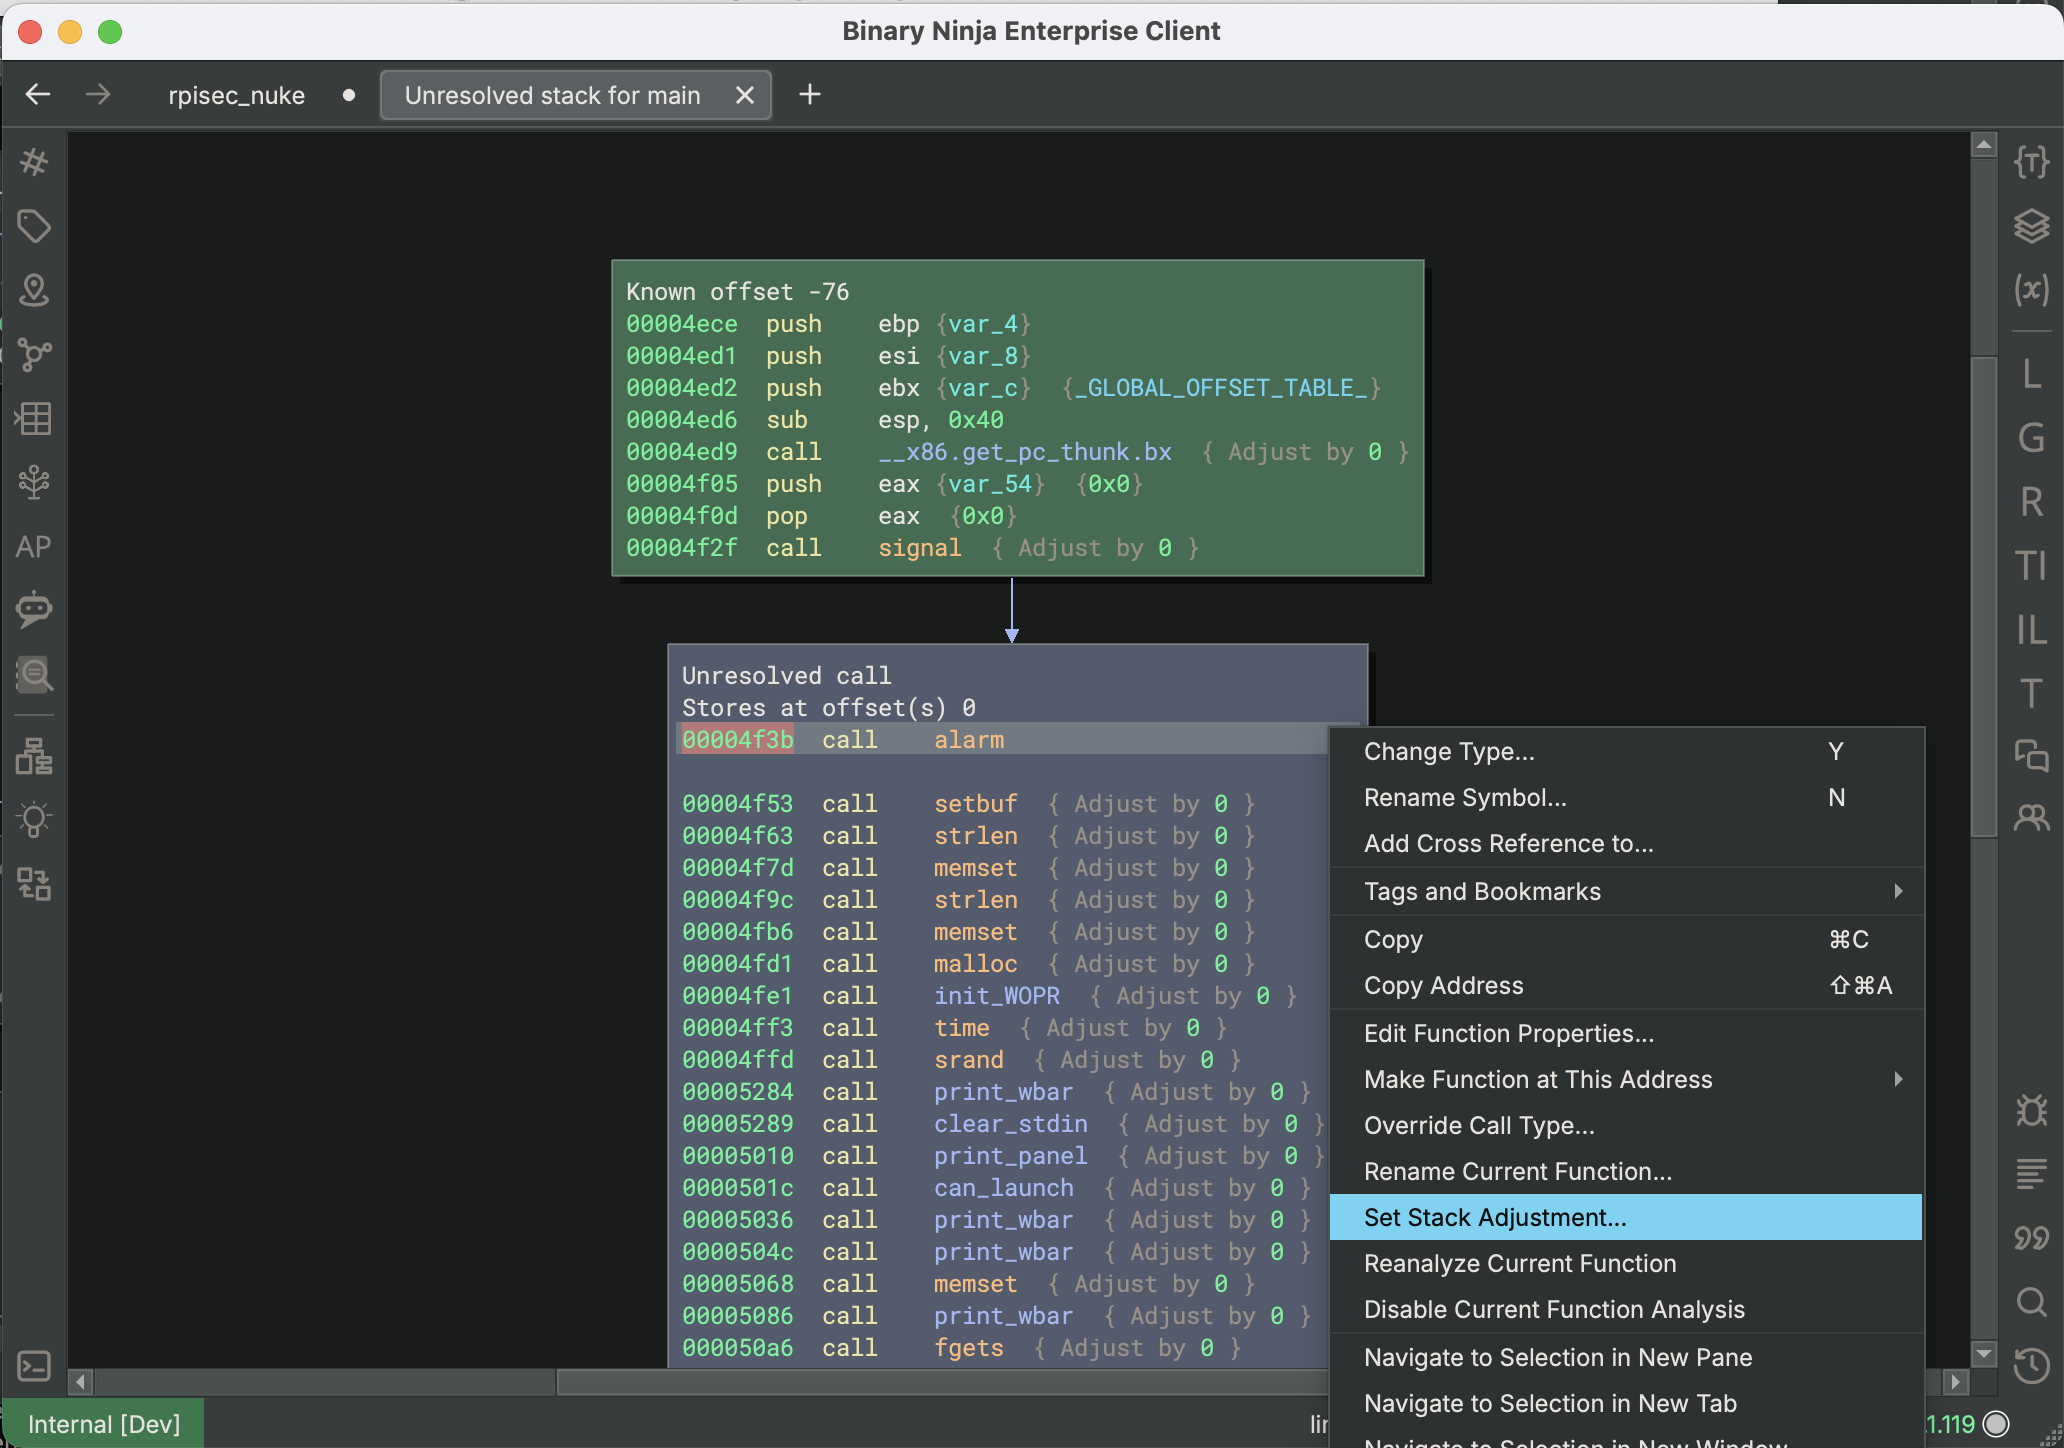
Sometimes, when functions make calls, Binary Ninja cannot automatically determine if the Stack Pointer is adjusted or preserved during the call. In these cases, you can get access to the Stack Adjustment Graph Debug Report and inspect the many steps taken to attempt to resolve the problem. Note that this is actually different from the Unresolved Stack Display, which is the view you can access from the warning message to manually fix up the calls. Observe how Binary Ninja still shows an Unresolved Stack Usage warning for that function. Clicking “View graph of stack usage” will open the Unresolved Stack Display, where you can find and correct the unresolved call:
However, before doing this, you can use the Python command current_function.request_debug_report("stack_adjust_graph") to get a thorough breakdown of exactly how Binary Ninja tried (and failed) to follow the Stack Pointer offset through the function:
This display may be helpful for you in determining which calls caused Stack Pointer analysis to fail, since you can see the analysis details over time and pinpoint which places may have caused a problem.
Lifted IL: Show IL Flag Usage
When writing a lifter, one of the many features you will have to handle is flag usage. Unlike many other disassemblers, Binary Ninja uses a system known as Semantic Flags. In this system, architectures specify instructions that set and use flags, but do not calculate their values directly. As a result of this, you may want more insight into how these flags are used in analysis. If you switch to the Lifted IL view (under the IL Type menu > Advanced sub-menu) and enable the Show IL Flag Usage option (under the View Options menu > Advanced sub-menu), additional annotations are added showing flag usage:
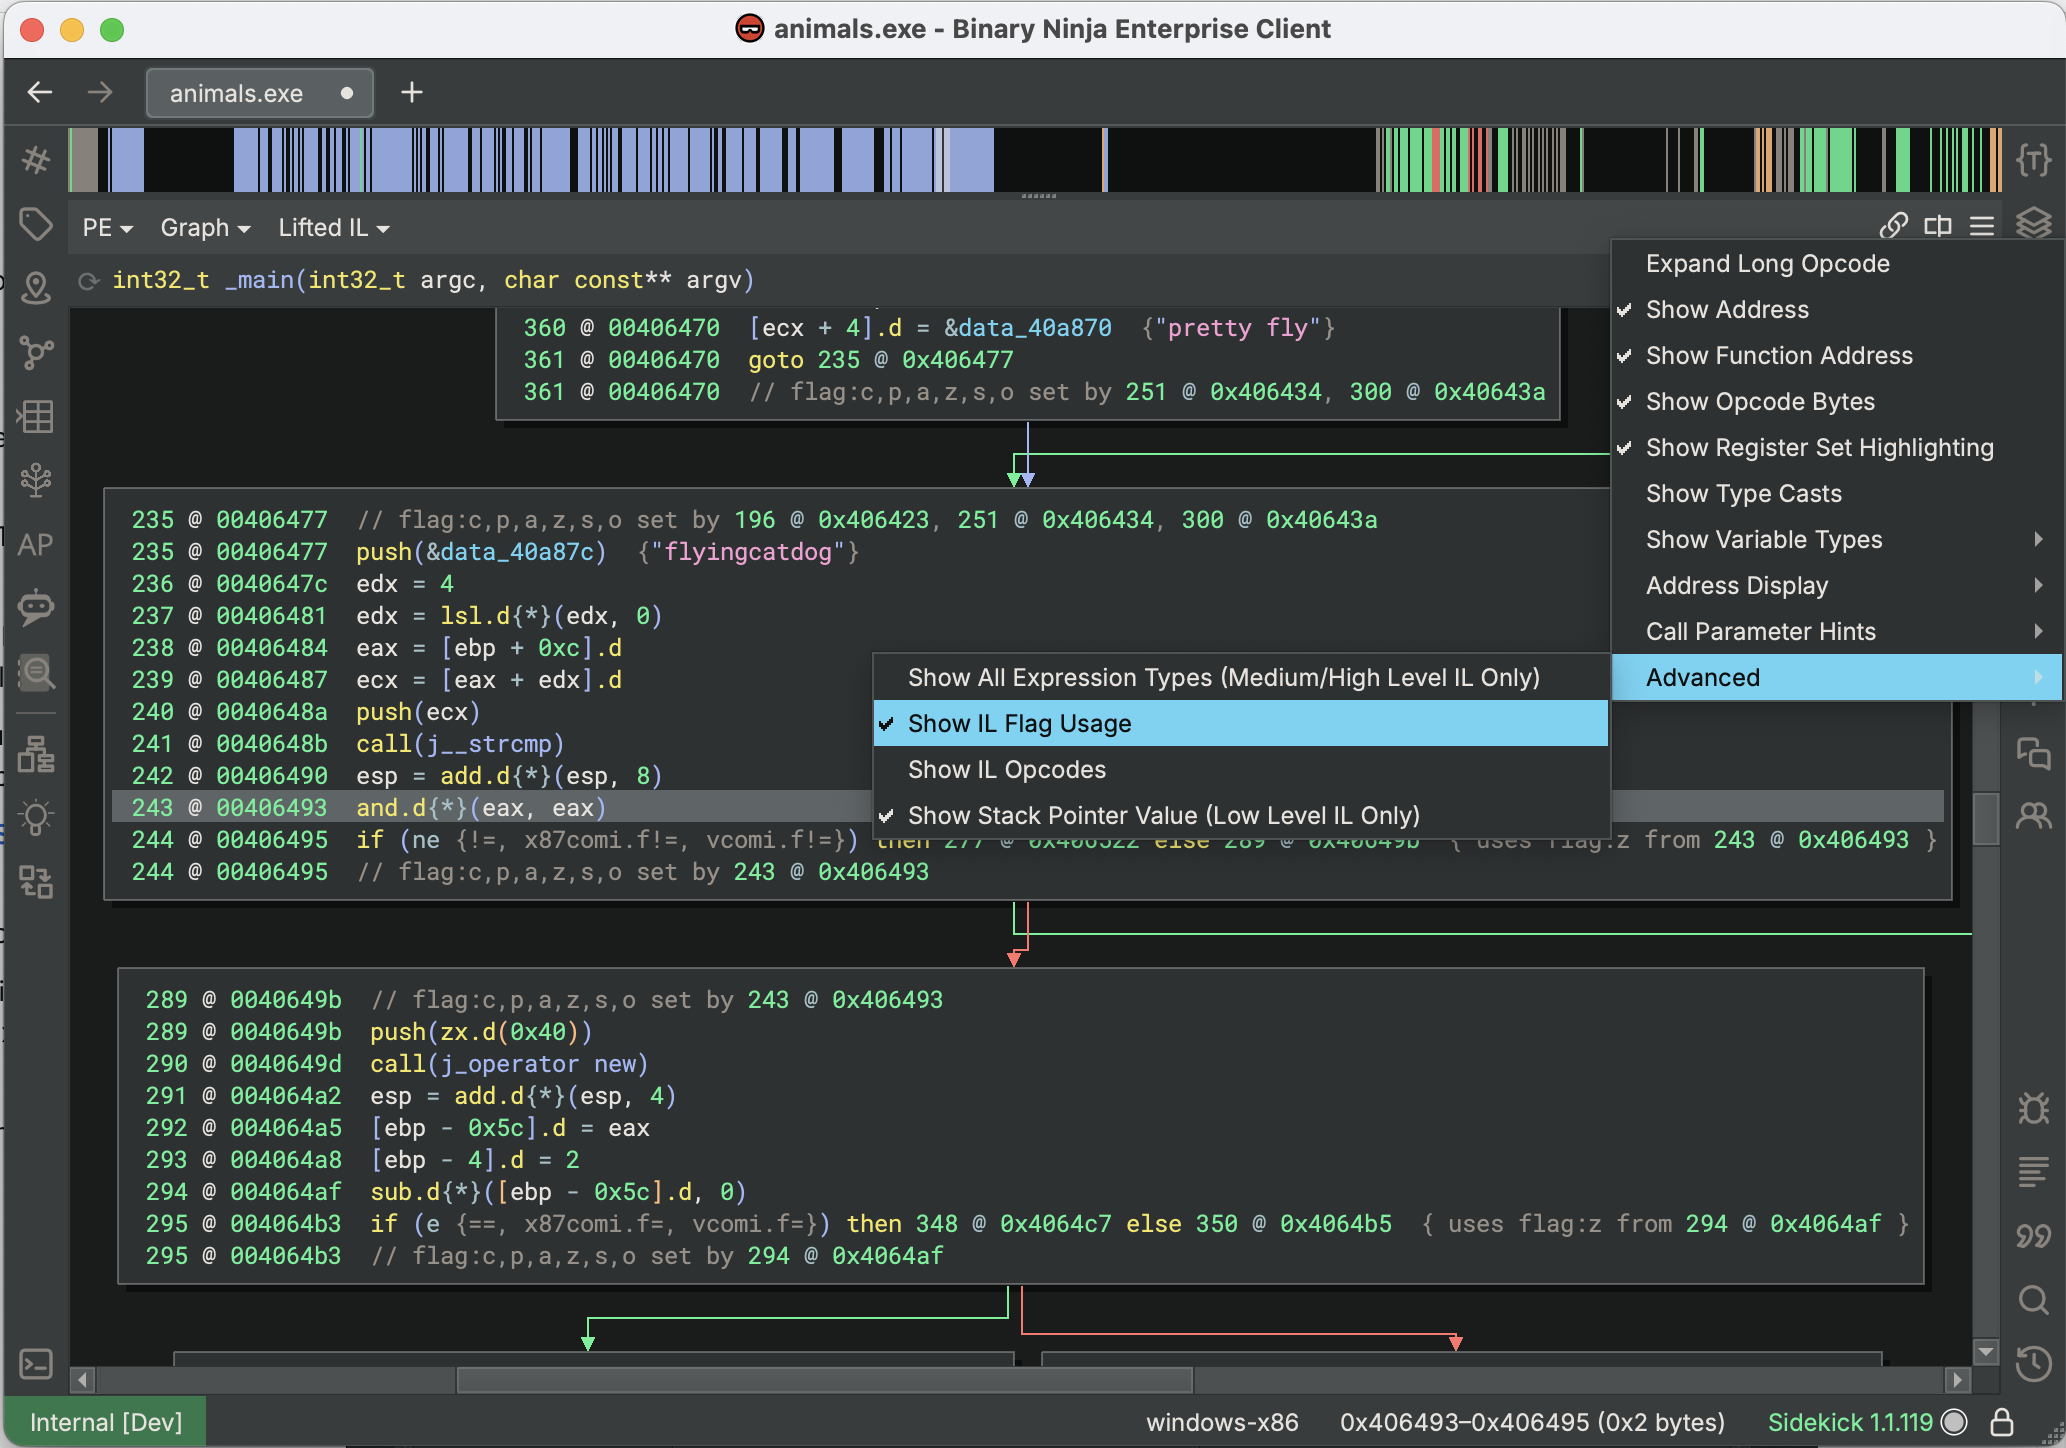
Notice how each block now has an annotation showing which instruction(s) set each of the flags. Instructions that use these flags, like if-statements, now have annotations showing which instruction set the flags they use. Flag uses are also annotated with their semantic flag groups and the location where those flags were set.
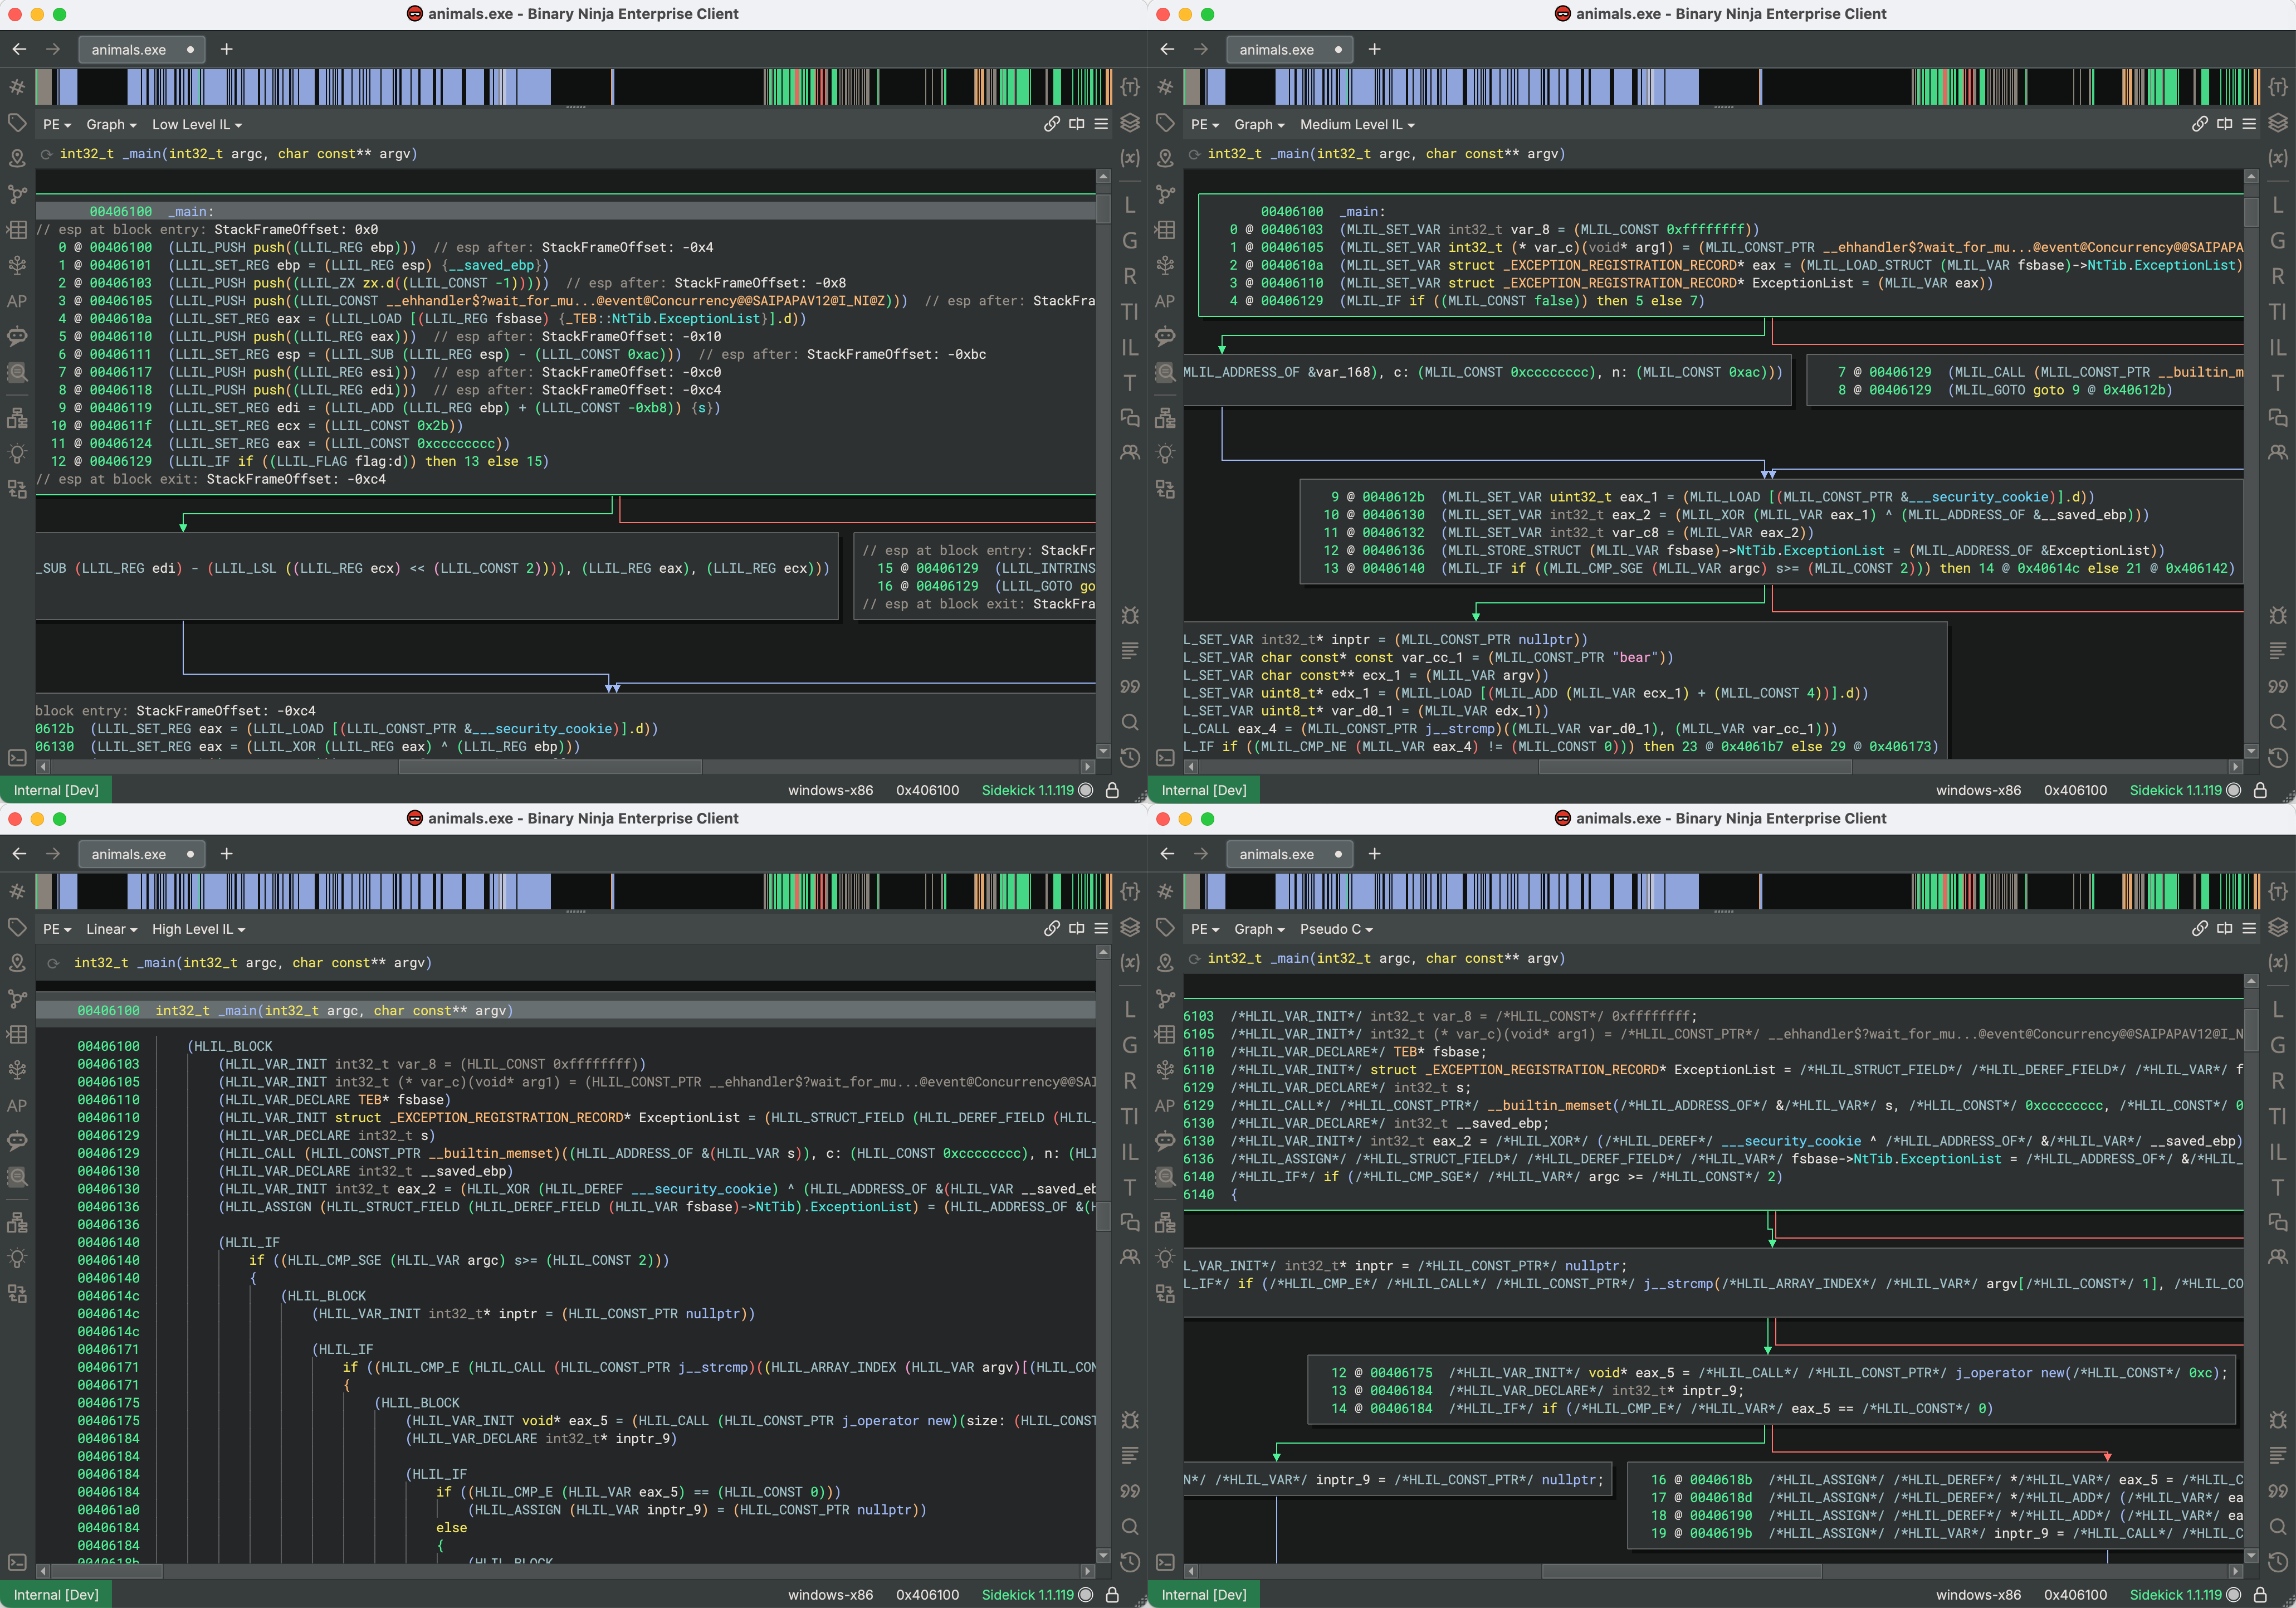
All ILs: Show IL Opcodes
When writing scripts that interact with the ILs, you usually have to check for the operation of IL instructions you’re processing, but since these operation names are not normally displayed in the UI, it may be difficult to debug the input your script will be getting. To help with this, Binary Ninja has a built-in option in the UI to render the operation of every IL instruction. When the “Show IL Opcodes” option is enabled (under the View Options menu > Advanced sub-menu), all instructions will be rendered with their operation name and surrounded by parentheses. This rendering mode is available in all levels of ILs, including SSA forms and Pseudo-C. Though the resulting display is verbose, it is very useful for writing scripts using the ILs:
Medium/High Level IL: Show All Expression Types
When working with Medium Level or High Level ILs, you will often have types applied to expressions in different depths of the instruction tree. In these cases, they are not normally printed (except sometimes in Pseudo-C), but their information can still be useful for both reversing and scripting. By enabling the Show All Expression Types option, (under the View Options menu > Advanced sub-menu) every expression with a type will have its type rendered using a C-like type cast syntax:
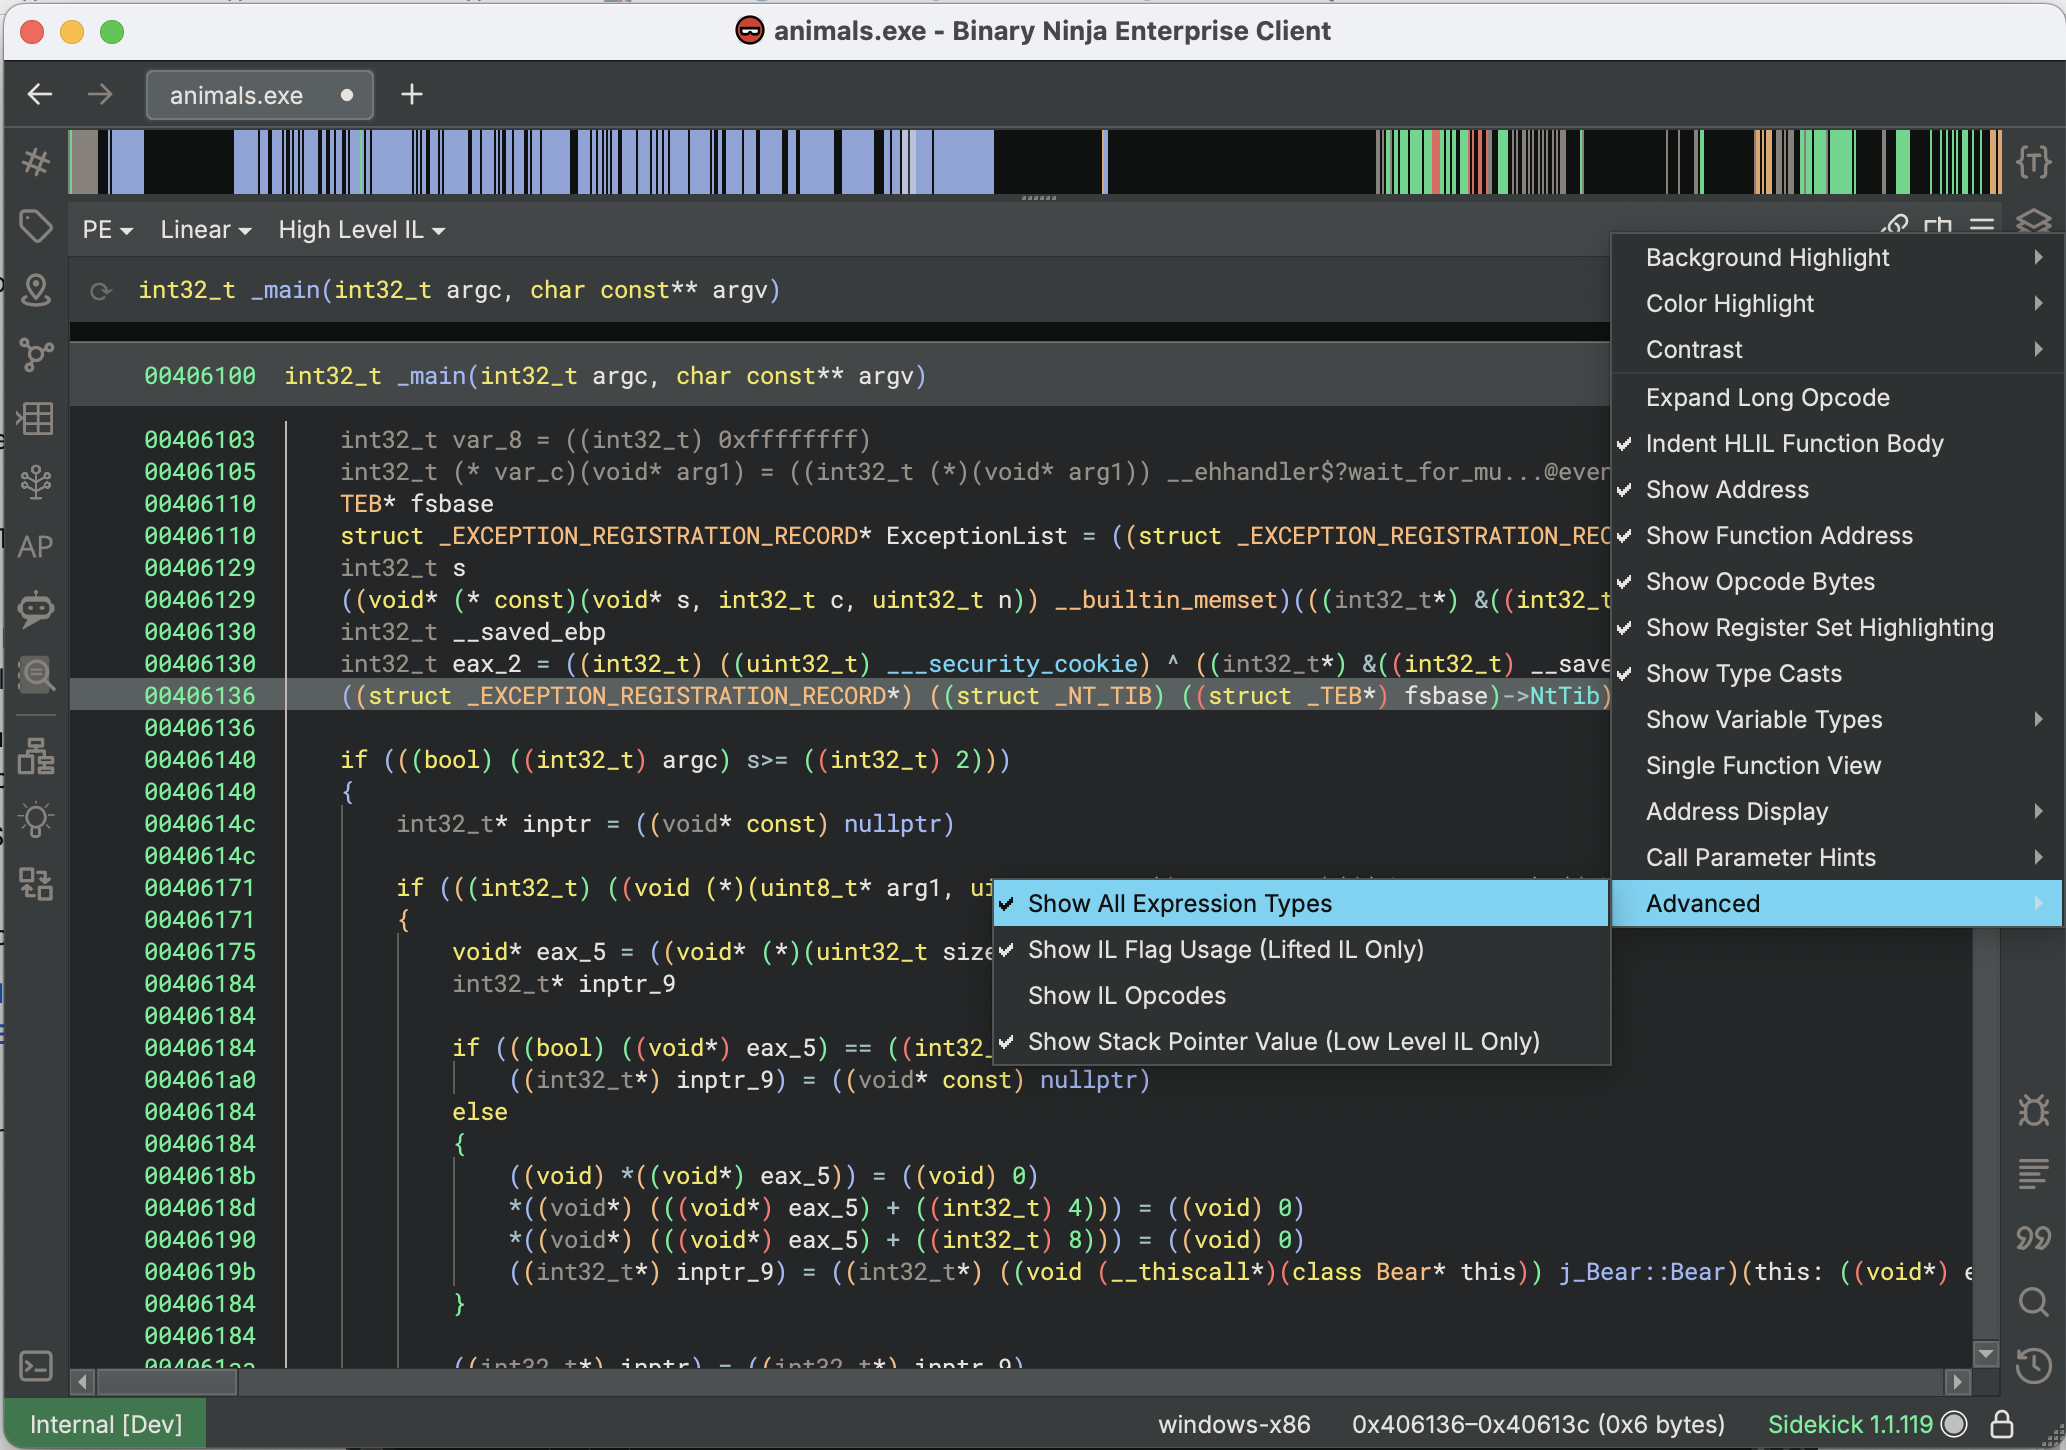
When reversing, having this much information about types can help you determine signedness of constants, types of intermediate expressions like structure dereferences, and type signatures of function pointer calls. It can be helpful in understanding how the decompilation produced the result you got, and potentially helpful in finding variables or functions with incorrect types which you can modify to improve results. For scripting, this information is super valuable when trying to do any type-based matching of expressions. MLIL/HLIL optimization passes routinely use the types of the expressions they are modifying, and being able to see them at a glance in context helps considerably when debugging.
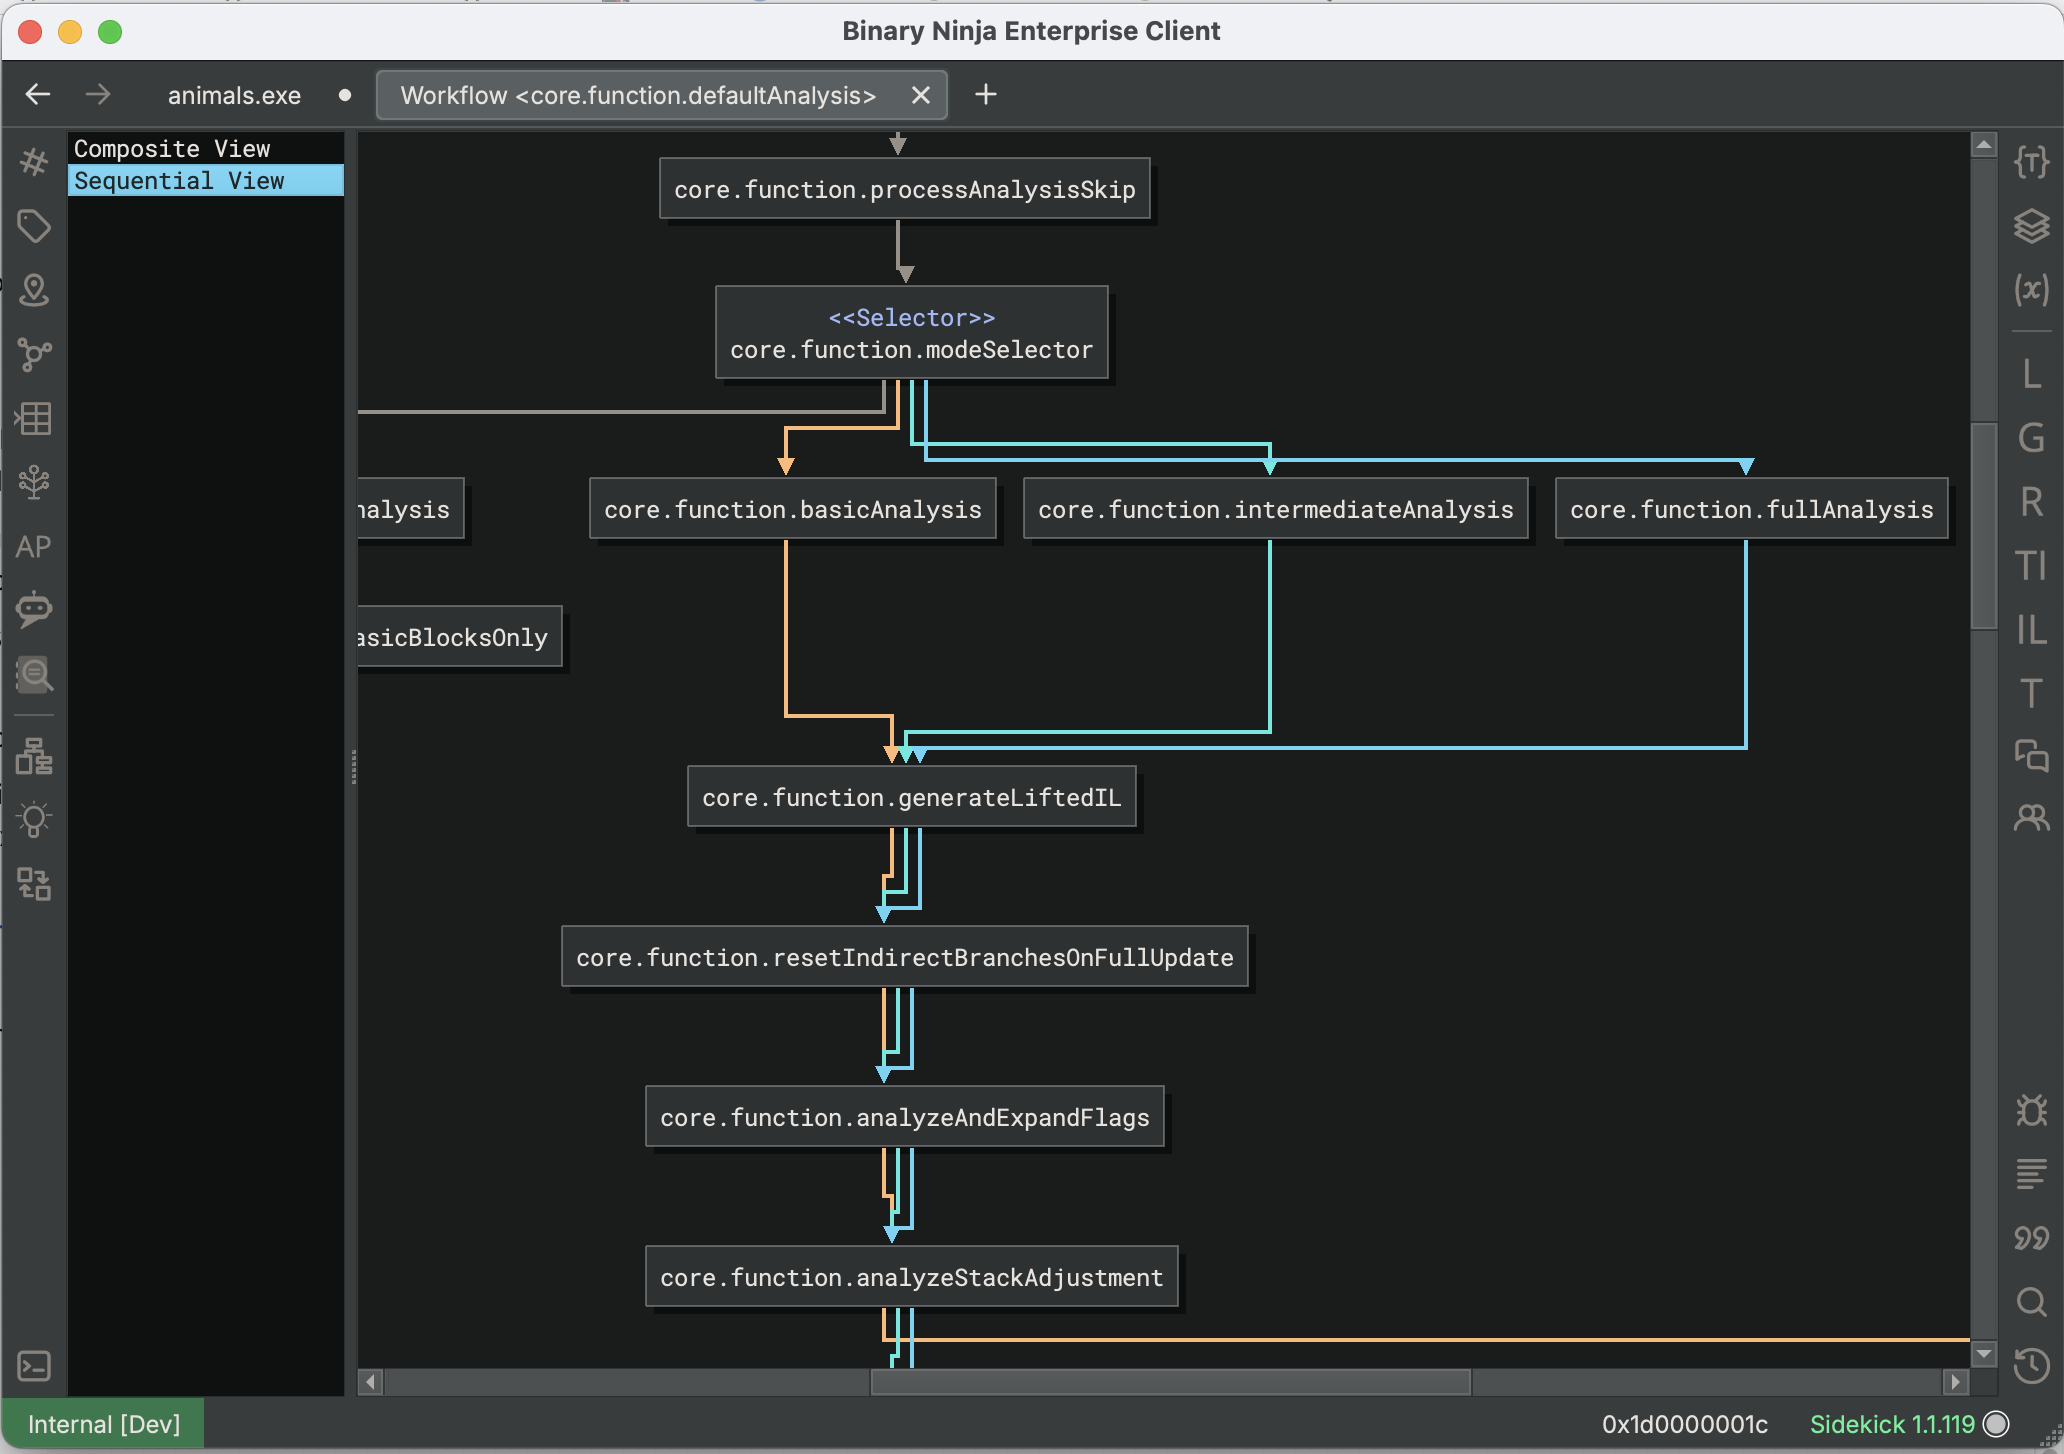
Workflow Topology Report
Workflows are Binary Ninja’s programmable analysis pipeline, and consist of a number of sequential and optional steps taken in the process of decompilation. If you are looking to customize the analysis with Workflow Actions of your own, it is helpful to see a complete overview of the steps involved, and use this to decide where best to insert your code. Accessible from the Python console via the command current_function.workflow.show_topology() you can inspect the Workflow steps via the displayed graph. You will probably want to use the Sequential View display, and can follow the differently-colored arrows to see which paths are taken for which modes of analysis.
Note: you will need to have Workflows enabled in the settings to make use of them.
Conclusion
Binary Ninja has a ton of lesser-known features for seeing more deeply into the complex processes involved in decompilation, and they are all available to use built into the application for you. We hope reading about them has shown you tools to improve your analysis and scripting experiences, and helps you with some of the challenges you could face in your future work.