In Binary Ninja’s debugger, when you set a breakpoint and add a condition like rax == 0x1234, it just works. Let’s take a look into how that works and what sorts of conditions you can use.
This post tells the story of the conditional breakpoint with a side-quest to explore Binary Ninja’s expression parser which is the feature that makes it possible.
It Started with Navigation
If you’ve used Binary Ninja, you’ve probably pressed G to open the navigation dialog and typed in a function name. But did you know that dialog is powered by a full expression parser? This means you can type main + 0x10 to navigate 16 bytes past the start of main, or .text + 0x100 to jump to an offset within a section, or even [.data + 0x20] to dereference a pointer.
The expression parser can do a lot more than you would probably guess. Here’s some examples:
Expression Parser Capabilities
| Feature | Example | Description |
|---|---|---|
| Arithmetic | main + 0x10 |
Navigate 16 bytes after main |
| Sections | .text + 0x100 |
Offset into a section |
| Symbols | data_00005000 |
Unnamed data variables |
| Dereference | [.data + 0x20] |
Read pointer at address |
| Size suffix | [.data + 0x20].q |
Read 8 bytes (quadword) |
| Special values | $here, $start, $end |
Current address, file boundaries |
The supported operators include arithmetic (+, -, *, /, %), bitwise operations (&, |, ^, ~), comparisons (==, !=, >, <, >=, <=), and grouping with parentheses.
For memory dereferences, you can specify the size: [expr].b for a byte, [expr].w for a word, [expr].d for a dword, and [expr].q for a quadword. Without a suffix, it reads an address-sized value.
Numbers default to hexadecimal, but you can use 0n10 for decimal or 010 for octal when needed.
For the complete specification, see the parse_expression API documentation.
Making It Dynamic: Magic Values
The expression parser becomes even more powerful during debugging thanks to “magic values” which are name-value pairs that can be registered at runtime.
When you’re in a debug session, the debugger automatically registers all CPU registers (rax, rbx, rsp, rbp, rip, etc.) and module bases (kernel32, ntdll, libc, etc.) into the expression parser. This enables some useful workflows:
- Type
rbp - 0x20to navigate directly to a stack variable — no manual calculation needed - Type
kernel32 + 0x1000to navigate into a loaded module, even with ASLR - Type
rspto jump straight to the stack pointer
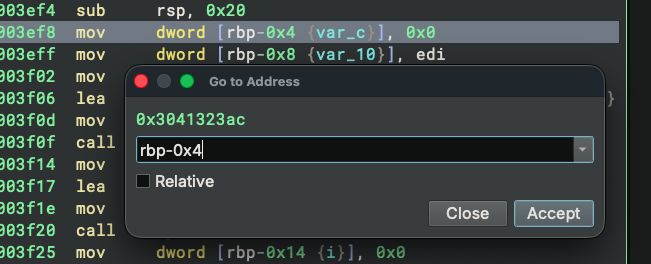
A quick note: historically, register names required a $ prefix (e.g., $rax). Register names can now be used directly, as in rax.
Plugin authors can take advantage of this system too. The add_expression_parser_magic_value API lets you register custom values. Imagine registering heap chunk addresses or TLS slots that users can then reference directly in expressions.
The 500-Line Feature
Conditional breakpoint support landed in December 2025, thanks to a PR from community contributor 3rdit. The entire feature (condition evaluation, UI, and API) took about 500 lines of code.
How is it possible to implement such a major feature in just 500 lines? The secret is that the condition evaluation uses the expression parser we just discussed. Here’s a simplified version of how it works:
bool DebuggerController::EvaluateBreakpointCondition(uint64_t address)
{
    const std::string condition = m_state->GetBreakpoints()->GetConditionAbsolute(address);
    if (condition.empty())
        return true;  // No condition means always stop

    // Use the expression parser to evaluate the condition
    uint64_t result = 0;
    std::string error;
    if (!BinaryView::ParseExpression(GetData(), condition, result, address, error))
        return true;  // Parse error, stop to be safe

    return result != 0;  // Non-zero means condition is true
}
The debugger simply calls ParseExpression on the condition string. If the result is non-zero, the condition is true and the debugger stops. That’s it. All the heavy lifting including parsing the expression, reading register values, performing arithmetic and comparisons is handled by the expression parser.
Because the condition is evaluated at the debugger core level rather than the adapter level, the same expression syntax is available across supported debugger adapters. The register and module names in an expression still depend on the target.
But Wait — Comparison Operators?
You might be wondering: how does the expression parser handle conditions like rax == 0x1234? After all, it was originally a navigation feature. What does a comparison even mean in that context?
Back in December 2022, while I was adding the magic value support for register values, I also added comparison operators to the expression parser: ==, !=, >, <, >=, <=. These operators return 1 if the condition is true, 0 otherwise.
I was already thinking ahead for conditional breakpoints. The expression parser already knew how to read register values and dereference memory locations making it a perfect match for evaluating breakpoint conditions. Adding comparison operators made it ready to use.
Then in December 2025, 3rdit reached out asking about adding conditional breakpoint support. I was excited — the foundation I’d laid three years earlier was finally going to be used. I told him that the expression parser was already there to support it so it shouldn’t be hard. He came back with PR #941, which was merged with little modification.
Thanks to 3rdit for the contribution!
How to Use Conditional Breakpoints
Here’s how to add a condition to a breakpoint.
Setting a Condition
- Add a breakpoint at the desired location
- Right-click the breakpoint in the Breakpoints widget
- Select “Edit Condition…”
- Enter your condition expression
- Click OK
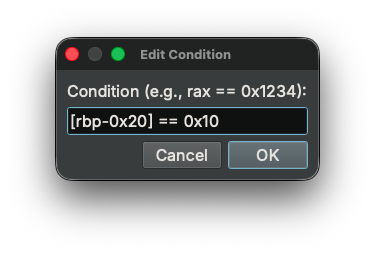
You can also view and edit conditions in the “Condition” column of the Breakpoints widget.
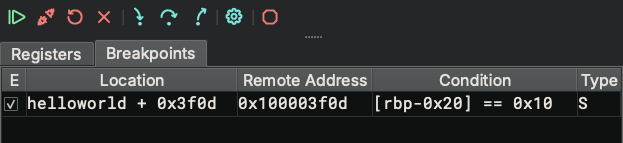
Example Conditions
These examples use x86-64 register names. Use the register names for your target architecture.
| Condition | When to stop |
|---|---|
rax == 0x1234 |
rax equals a specific value |
rax != 0 |
rax is non-zero |
rcx < 0n10 |
rcx is less than decimal 10 |
[rsp] == 0 |
The address-sized value at the stack pointer is zero |
rdi == rbp - 0x20 |
rdi equals a stack address |
Remember that unprefixed numbers are hexadecimal: 10 means sixteen; 0n10 means ten.
Using the API
In Binary Ninja’s Python console, dbg is the debugger controller for the current view. These examples assume you have already added breakpoints at the specified locations. Replace the addresses and module name with values from your target.
from binaryninja.debugger import ModuleNameAndOffset

# Set a condition
dbg.set_breakpoint_condition(0x401000, "rax == 0x1234")

# With module-relative address
dbg.set_breakpoint_condition(ModuleNameAndOffset("myprogram", 0x1000), "rdi != 0")

# Get current condition
condition = dbg.get_breakpoint_condition(0x401000)

# Clear condition (set to empty string)
dbg.set_breakpoint_condition(0x401000, "")
For more details, see the conditional breakpoints documentation.
What’s Next
The expression parser continues to evolve. One possible extension would be a string comparison function such as streq. For example, a hypothetical streq(rdi, "password") could stop when rdi points to that string. This is an idea for future work, not syntax you can use today.
We’d love to hear your feedback on what would make conditional breakpoints even more useful for your workflows.
Next time you press G in Binary Ninja, remember that you have a full expression parser at your fingertips. Skip the calculator and just use rbp - 0x20 during your next debugging session.
References
Documentation
- Expression Parser API (parse_expression)
- Magic Values API (add_expression_parser_magic_value)
- Conditional Breakpoints Guide